Compare
Compares the runs of one collection (an ablation study) fairly.
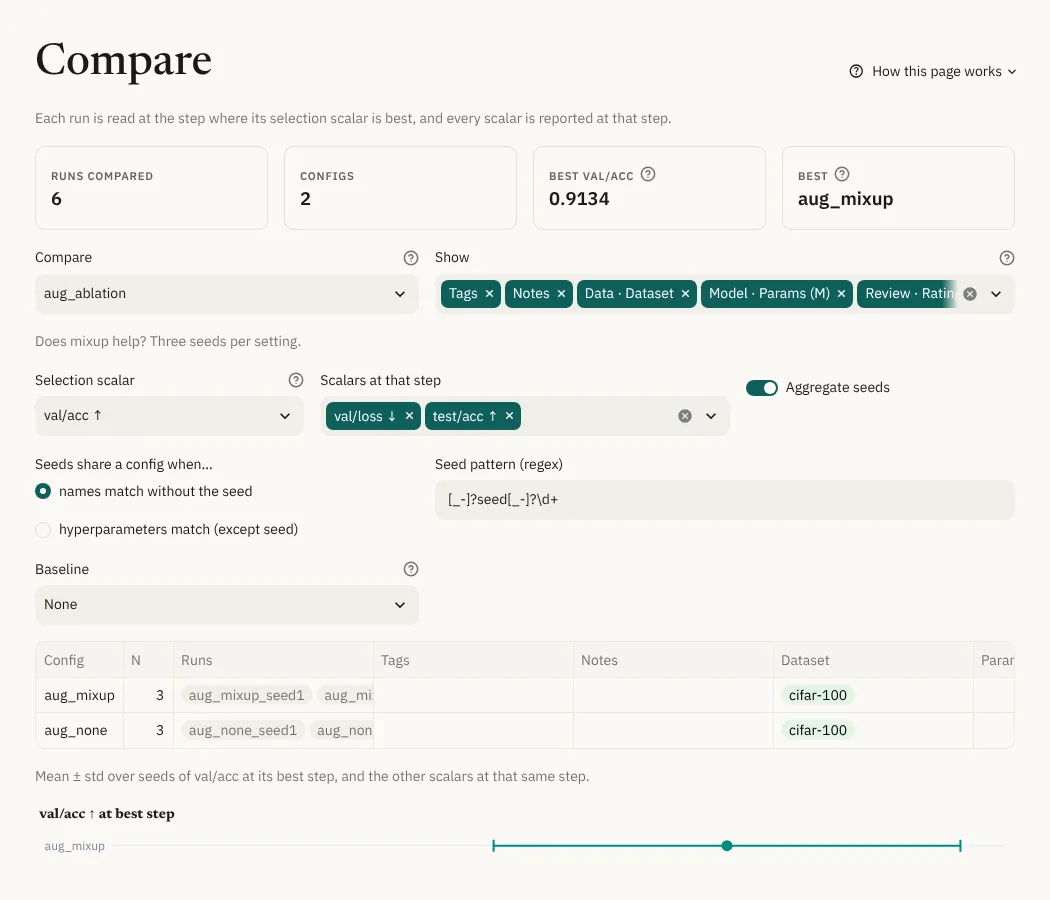
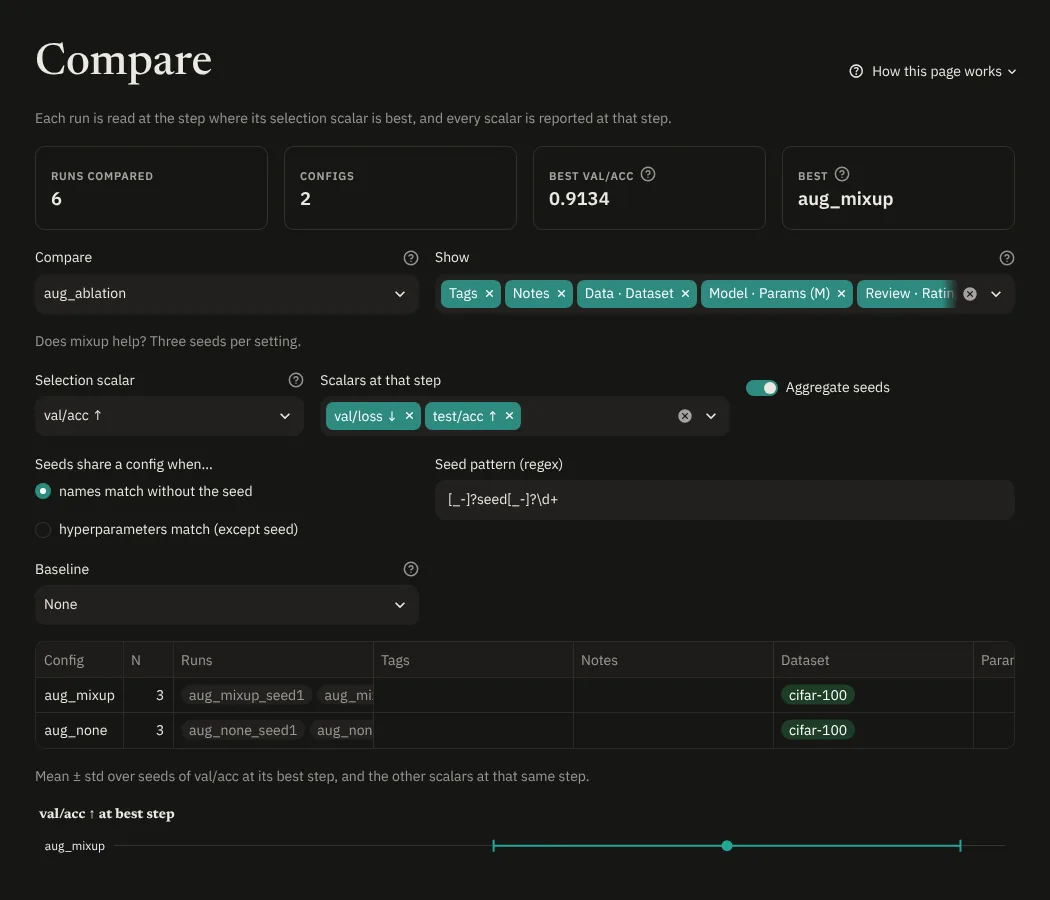
What to compare. A collection, Selected runs (the runs you ticked before pressing Compare in Experiments), or Runs shown in Experiments (the runs that pass the sidebar filters). Use Show to add tags, notes, status, collections, steps or fields to the table, so you can check that you're comparing the runs you meant to. When seeds are aggregated, a runs column lists the runs behind each row, number fields are averaged and choice fields list their values.
Selection scalar. For each run, the step where this scalar is best is chosen (the "checkpoint"). Every scalar in Scalars at that step is shown at that same step, using the logged value closest to it. That's how test scores should be reported: picking the best test value on its own would be cherry-picking.
Baseline. Pick a run (or, with seeds aggregated, a config) to show
each number's difference to it in brackets, e.g. 0.9414 (+0.0147).
Green means better and orange means worse, following the scalar's
direction. The differences are also in the exports. With None, the
default, the table shows no differences.
Aggregate seeds. Collapses runs that differ only by their seed into one
row with mean ± standard deviation and the number of runs (n). Two ways to
decide that runs share a config:
- their names match after removing the seed pattern (
_seed1,-seed-2, and so on). The pattern is a regular expression that can be edited. - all hyperparameters match except the ones named
seed.
Below the table:
- a dot plot of the selection scalar (with error bars when aggregated).
- What differs between these runs: the hyperparameters that vary, with cells highlighted where they differ from the best run.
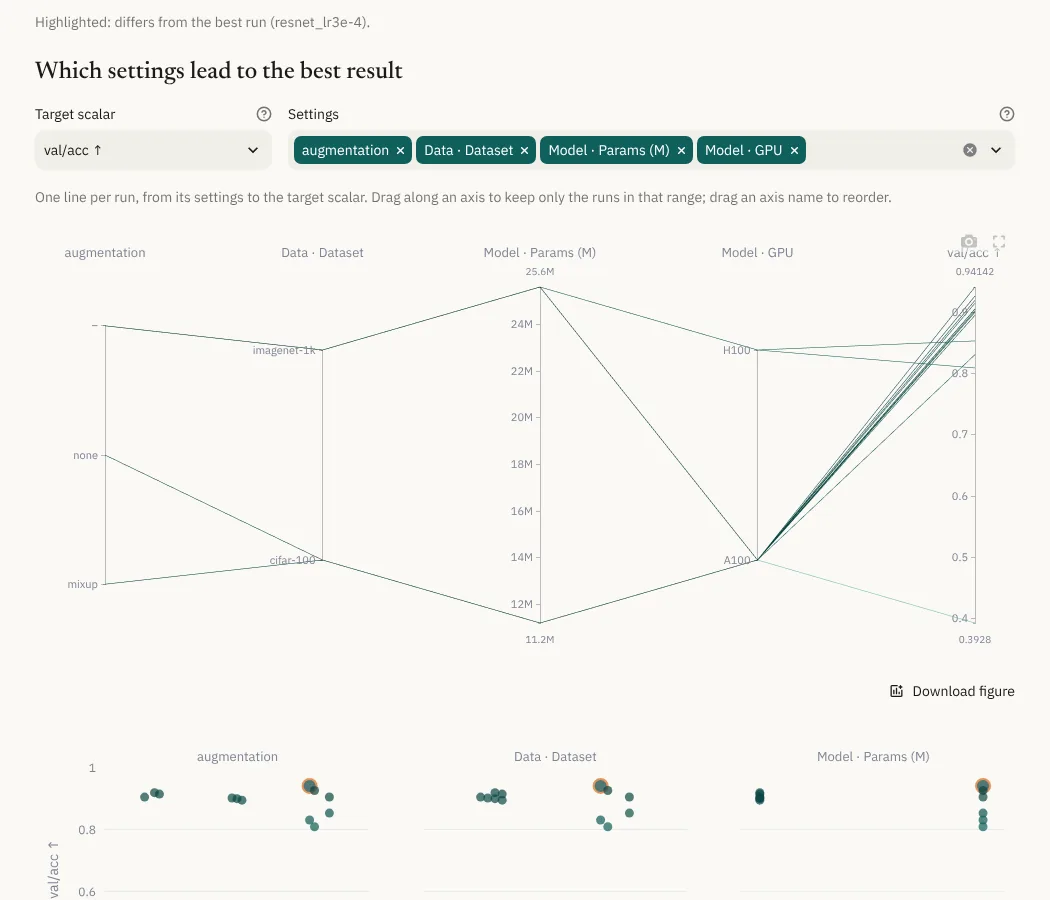
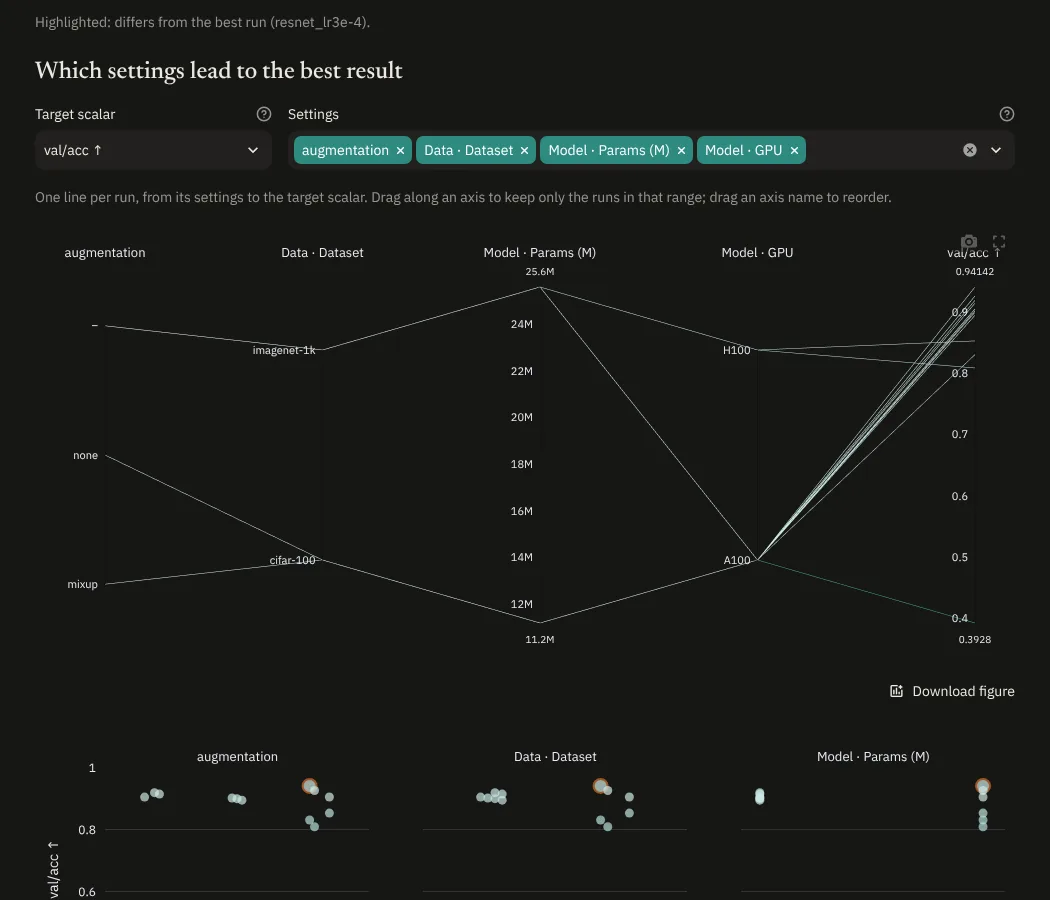
- Which settings lead to the best result: pick a Target scalar and the Settings (hyperparameters and number fields) to see, like TensorBoard's HParams dashboard, a parallel coordinates plot and the target against each setting, with the best run ringed. The parallel coordinates plot has one line per run, colored by the target. Drag along an axis to keep only the runs in that range, or drag an axis name to reorder the axes. Wide-ranging numbers such as learning rates use a log scale, and missing values are shown as a dash.
- exports as CSV, Markdown or LaTeX (with the best value in bold).
The cards on top show how many runs and configs are compared and which one is best. The selection scalar is saved with the collection.
Open in TensorBoard (under the table) starts TensorBoard on exactly the compared runs. See TensorBoard.
The link in the address bar opens this exact comparison, so it can be shared or bookmarked. It keeps the collection (or the runs, when they aren't one), the selection scalar, the scalars at that step, the Show columns, the seed options and the baseline. Opening it asks for the password first if one is set.
Which settings lead to the best result