Run details
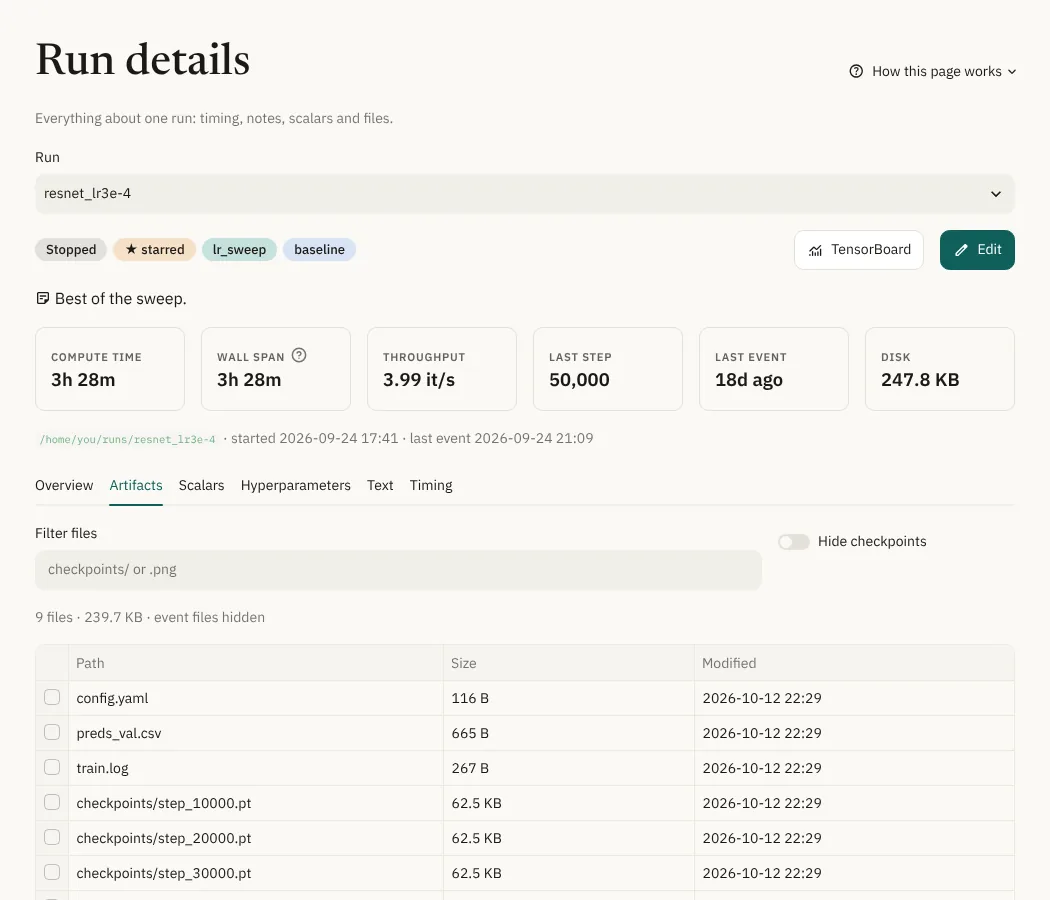
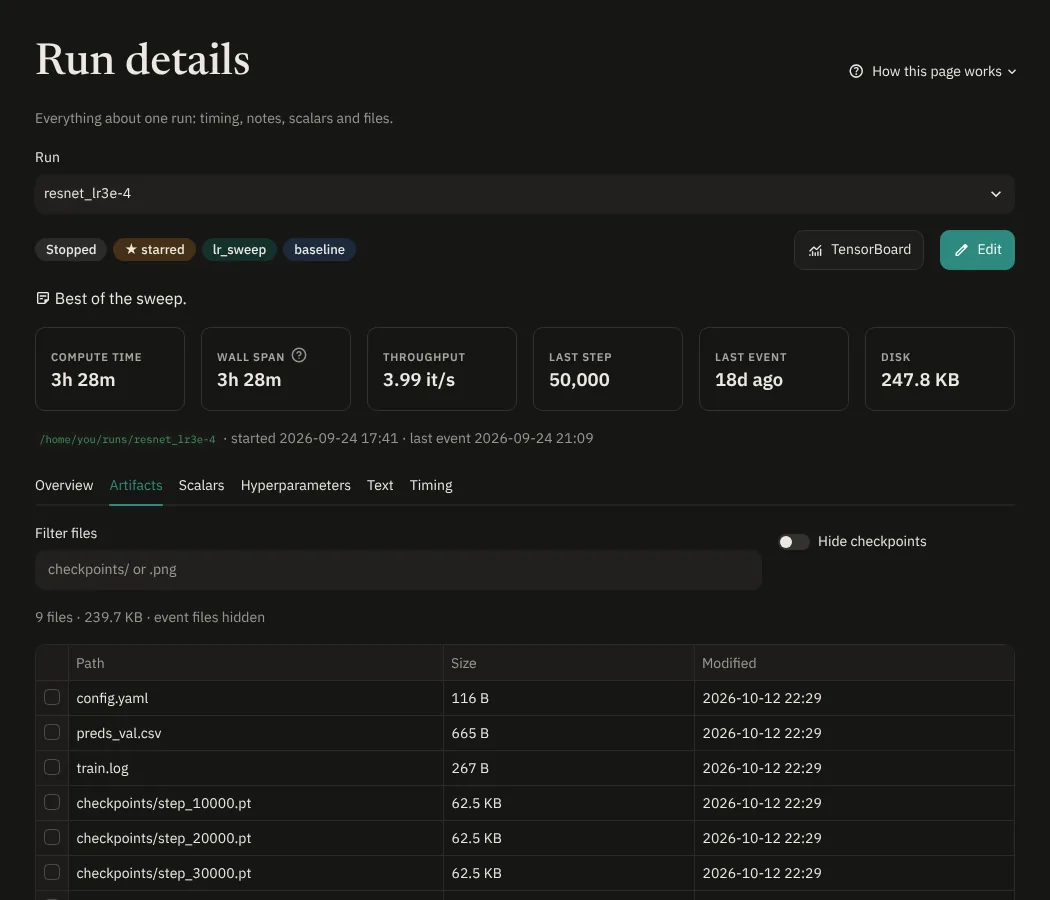
Everything about one run.
Top. Status, collections, tags and flags, then compute time, wall span, throughput (steps per second of compute), last step, time since the last event, and disk size.
TensorBoard next to the badges opens this run in TensorBoard.
Edit (next to TensorBoard) opens the editor in place of the
page: one card per field group, with Tags
under General, then the run's collections, star and archive flag, then
its notes. Each field has the input of its type: a number (typed in the
field's unit, and it can end in a prefix such as 25.6M), a choice or
tags list (type a new value to add it as an option), yes/no, a date, a
link or text. Add a field defines a new one without leaving the
editor. Press Save changes, or Cancel.
Tabs:
- Overview: the run's fields in cards, one per field group, with units and colored options, then its collections. Empty fields are hidden unless you turn on Show empty fields.
- Artifacts: every file in the run folder except event files. Select a file to preview it (images, text and config files, CSV/TSV tables, audio, video) and download it. Select several to download a zip. For text files, pick another run to see a diff of the same file. A config file is compared with the config file of the other run, even when the two have different names.
- Scalars: every scalar with best, best step, last, min, max, number of points and NaN/inf count.
- Hyperparameters: the flattened config, where each value came from, and the run's main config file. Compare with another run lists the hyperparameters that differ, whatever the names and formats of the two config files, and their line-by-line difference.
- Text: text summaries (e.g. from
add_text). - Timing: activity segments and the pauses between them.
The command to open this run in TensorBoard is at the bottom of the Scalars tab.