Experiments
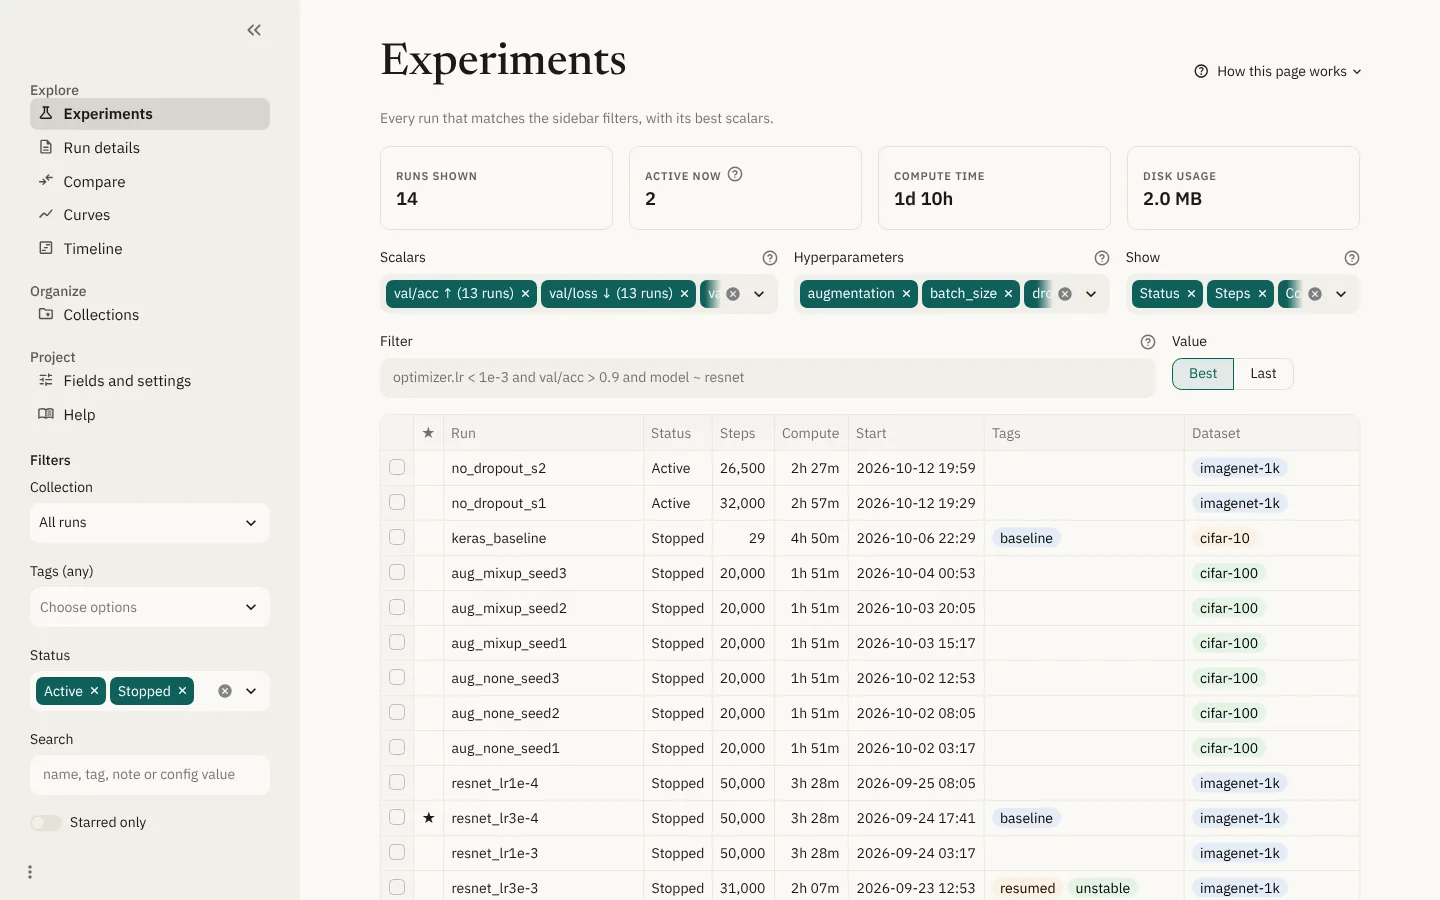
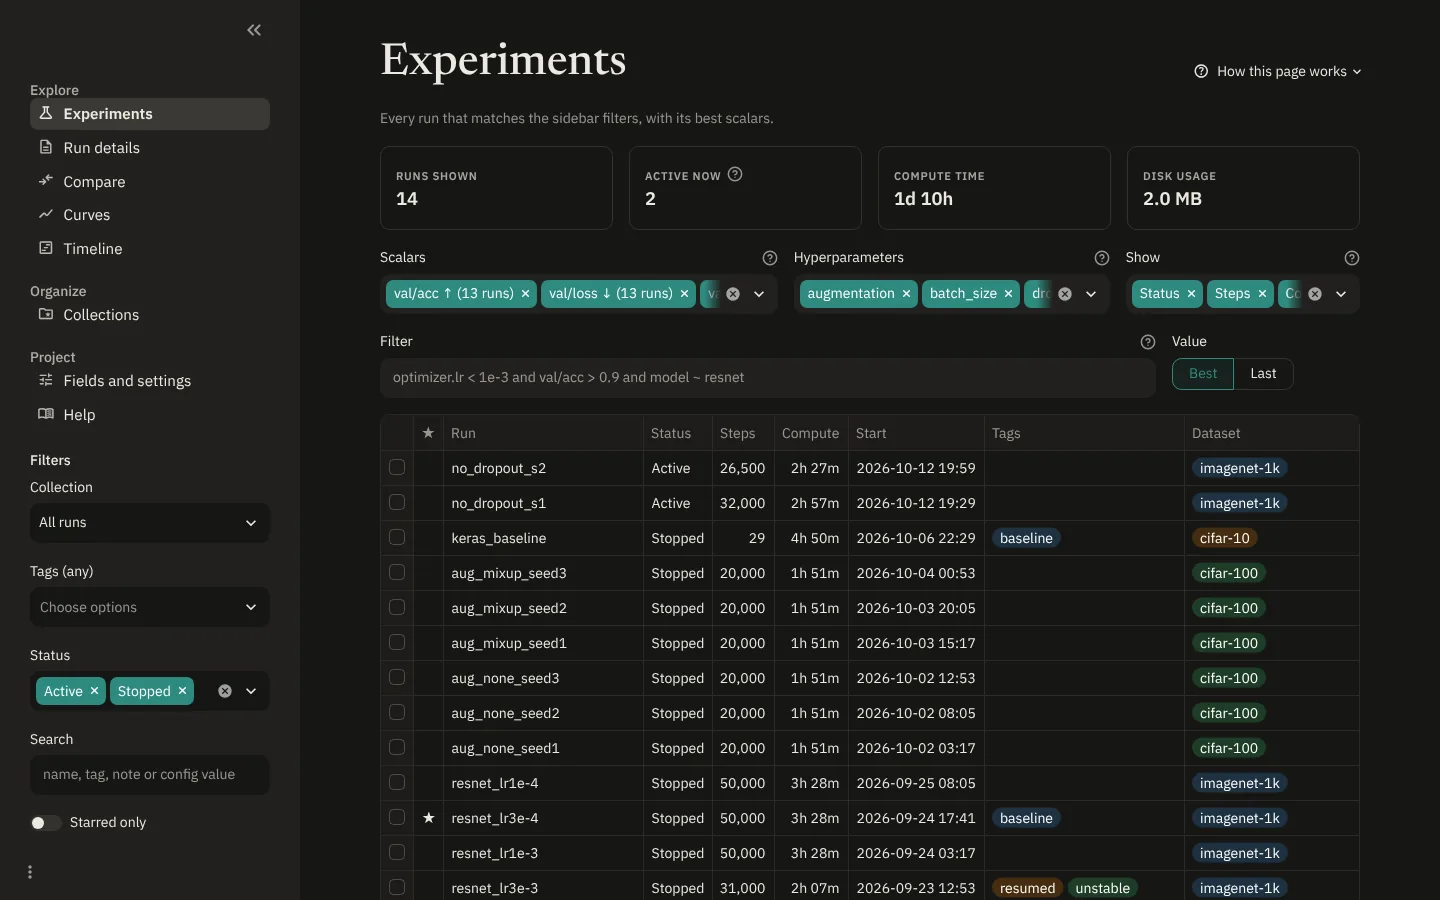
The main table, with one row per run.
Columns. Pick them in the three boxes at the top:
- Scalars: the value per run is the best one (highest or lowest, depending on the scalar's direction, shown by ↑ and ↓) or the last one, depending on the Value switch. The best value in each column is highlighted. Your choice is saved per collection.
- Hyperparameters: by default, the ones that differ between the runs shown.
- Show: extra columns such as status, steps, compute time, start, tags
(as colored pills), collections, notes and your fields. Fields are listed
with their group, as
Model · params (M); see Fields.
Filter. Narrow the table with conditions, e.g.
optimizer.lr < 1e-3 and val/acc > 0.9. See Filters.
Actions. Tick rows and use the buttons under the table. They are greyed out until they apply:
- Open in: Run details (one run), Curves, or TensorBoard, which starts TensorBoard on the selected runs (see the TensorBoard topic).
- Compare (two or more runs) opens them in Compare, even if they aren't in a collection.
- Add to collection adds them to a collection (or a new one) or removes them from the current one.
- Field sets or clears a field on all selected runs. Pick Tags to add or remove tags.
- Star and Archive: archived runs are hidden unless you turn on Show archived in the sidebar. Their files are untouched.
- Export CSV saves the table as shown.
The numbers on top. The number of runs shown, how many are active (see the ⓘ next to Active now), total compute time, and disk usage.