Timeline
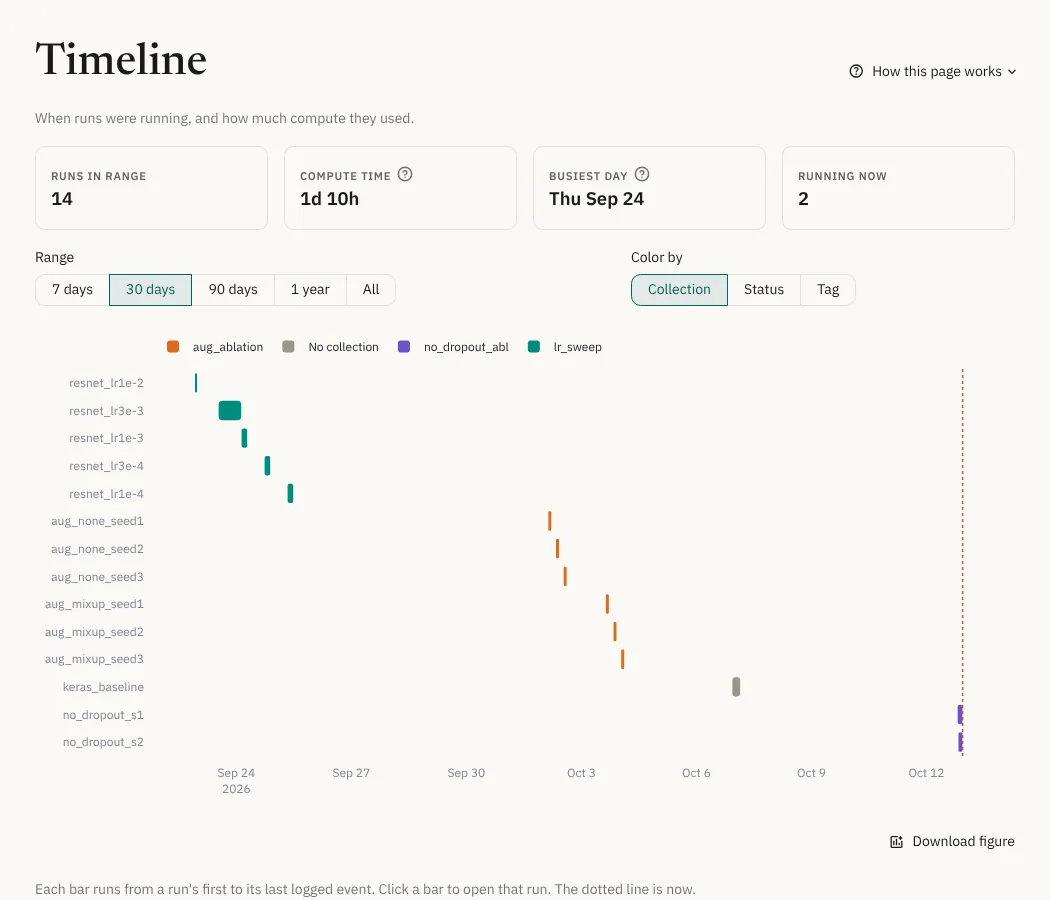
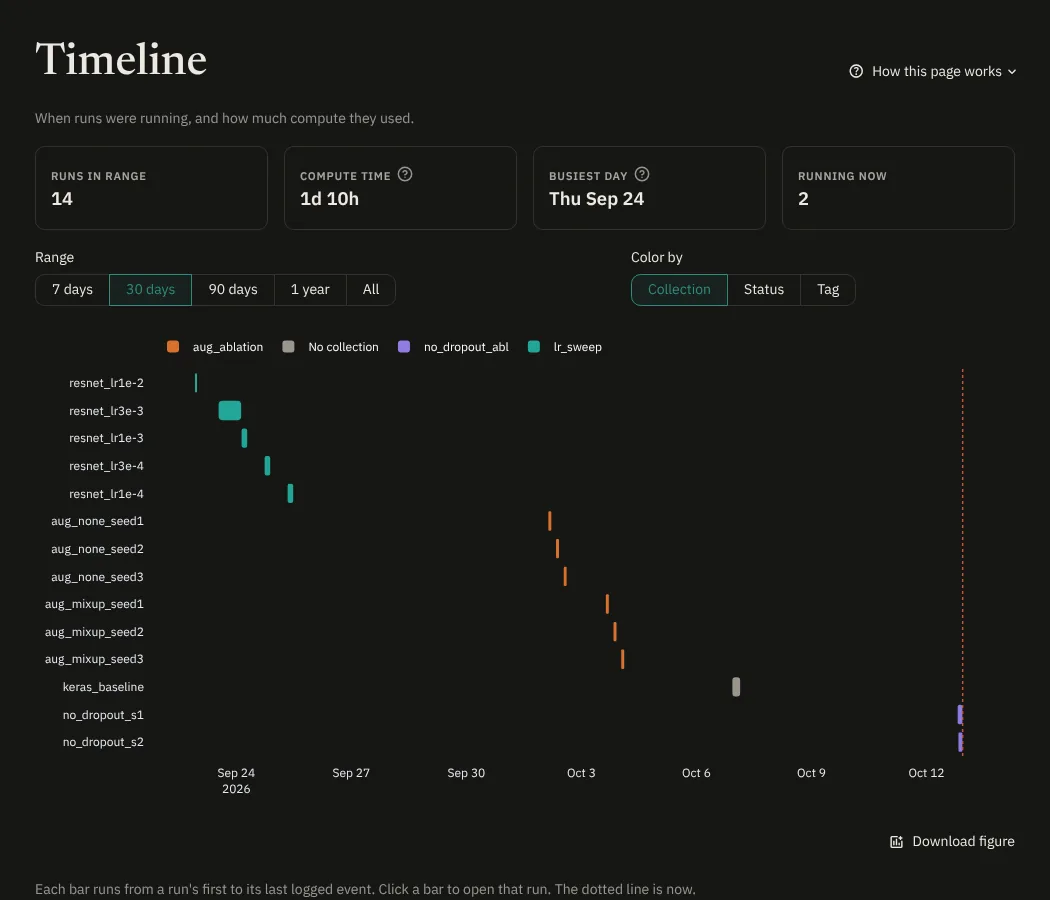
Shows when runs were running.
- Bars: one per run, from its first to its last logged event. Hover for the span, the compute time and the status. Click a bar to open the run. The dotted line is now.
- Color by: collection, status or tag. A run with several tags takes the color of the first one in the order of the tag options (Fields and settings → Fields → Rename values), and the hover lists all of them. A run in several collections takes the color of the oldest one.
- Runs at once: how many runs were running at each moment. Useful to spot idle or overloaded machines.
- Compute hours per day: a calendar of how many hours of runs happened each day. Pauses (see below) are not counted.
The cards on top count the runs in the range, their compute time, the busiest day, and how many are running now.
Span vs compute time. A silence longer than the pause setting (6 h by default) counts as a pause, e.g. a job that crashed and was resumed the next day. Span is first to last event, and compute leaves out pauses. The Timing tab of a run lists its segments.
Times come from the clock of the machine that ran each job and are shown in your time zone. The start is the first logged event, so setup time before it isn't included.