
Experiment tracking that lives in a folder
nuboard logs your training runs with three Python calls, keeps every run as
a plain folder on disk, and opens thousands of them in a fast viewer that runs
on your own machine. There is no account to create, no server to keep running
and no database to back up.
pip install nuboard
uv pip install nuboard # or: uv add nuboard, in a uv project
import nuboard as nb

with nb.init("llm-pretrain", run_name="baseline", config={"lr": 3e-4}) as run:
    for step in range(10_000):
        loss = train_step()
        run.add_scalar({"train/loss": loss}, step=step)  # a few µs, never blocks training
$ nuboard up experiments
nuboard serving /home/me/experiments (31 runs) at http://localhost:6070/  (Ctrl+C to stop)
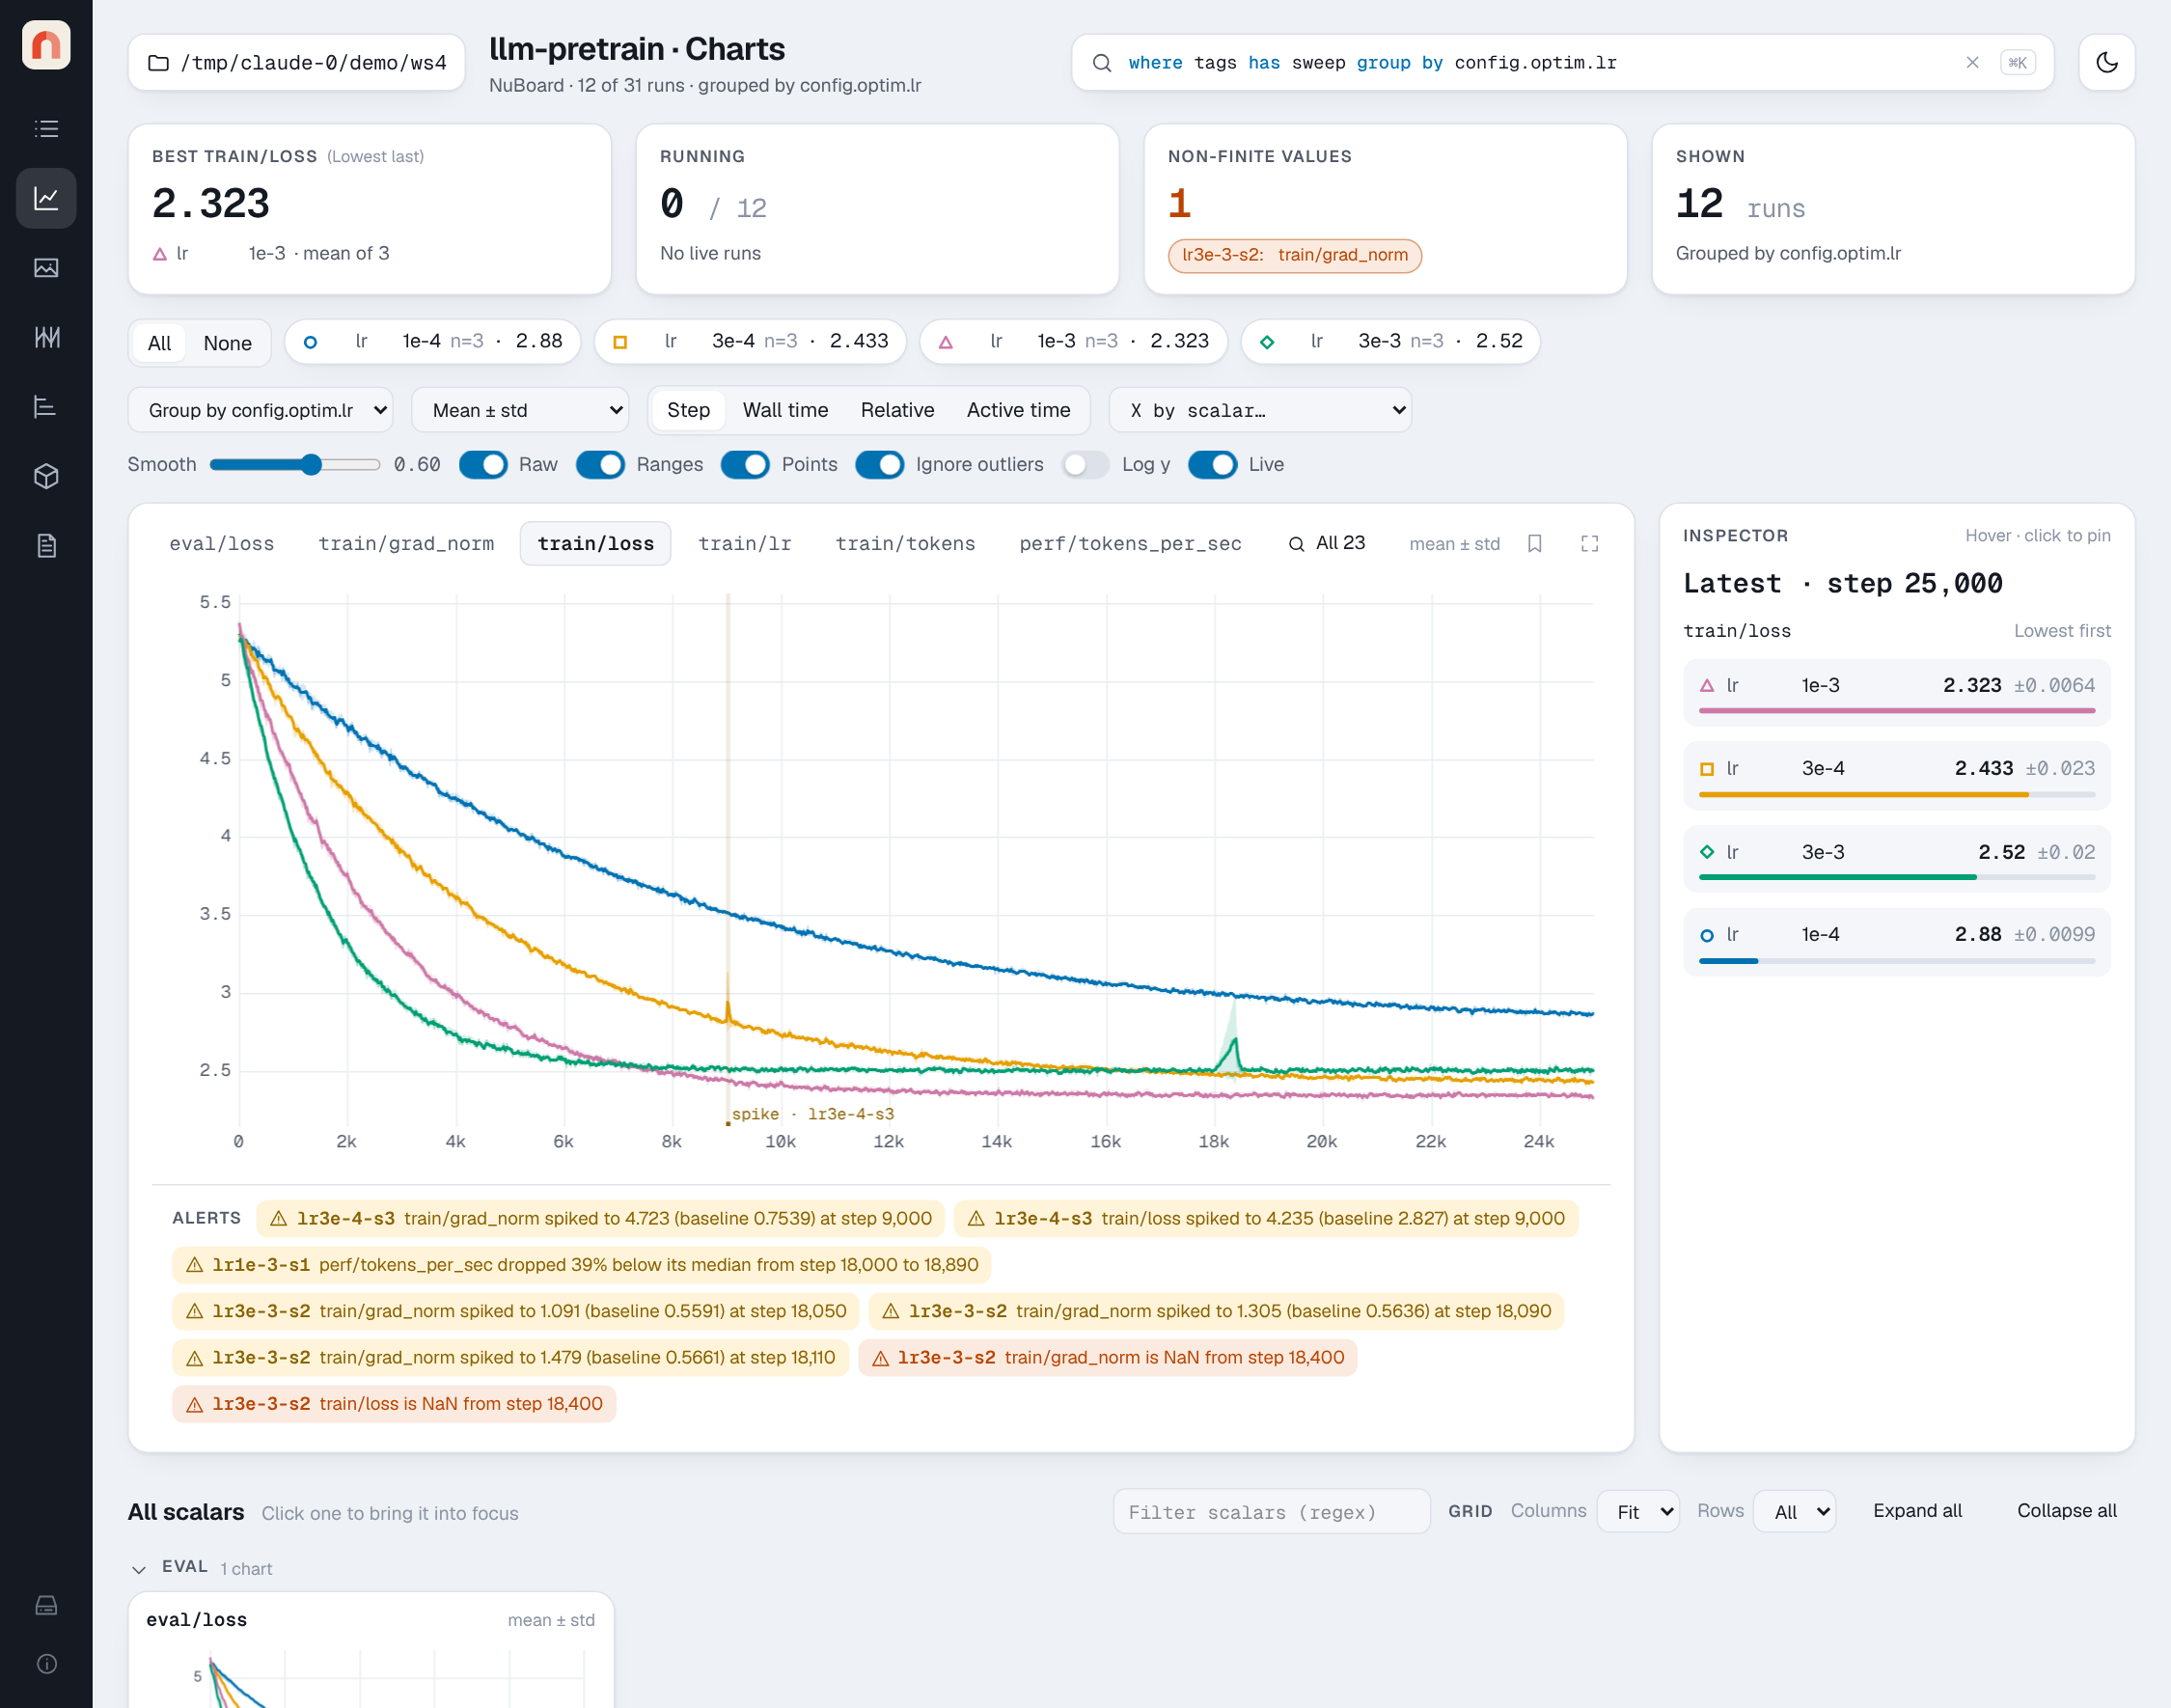
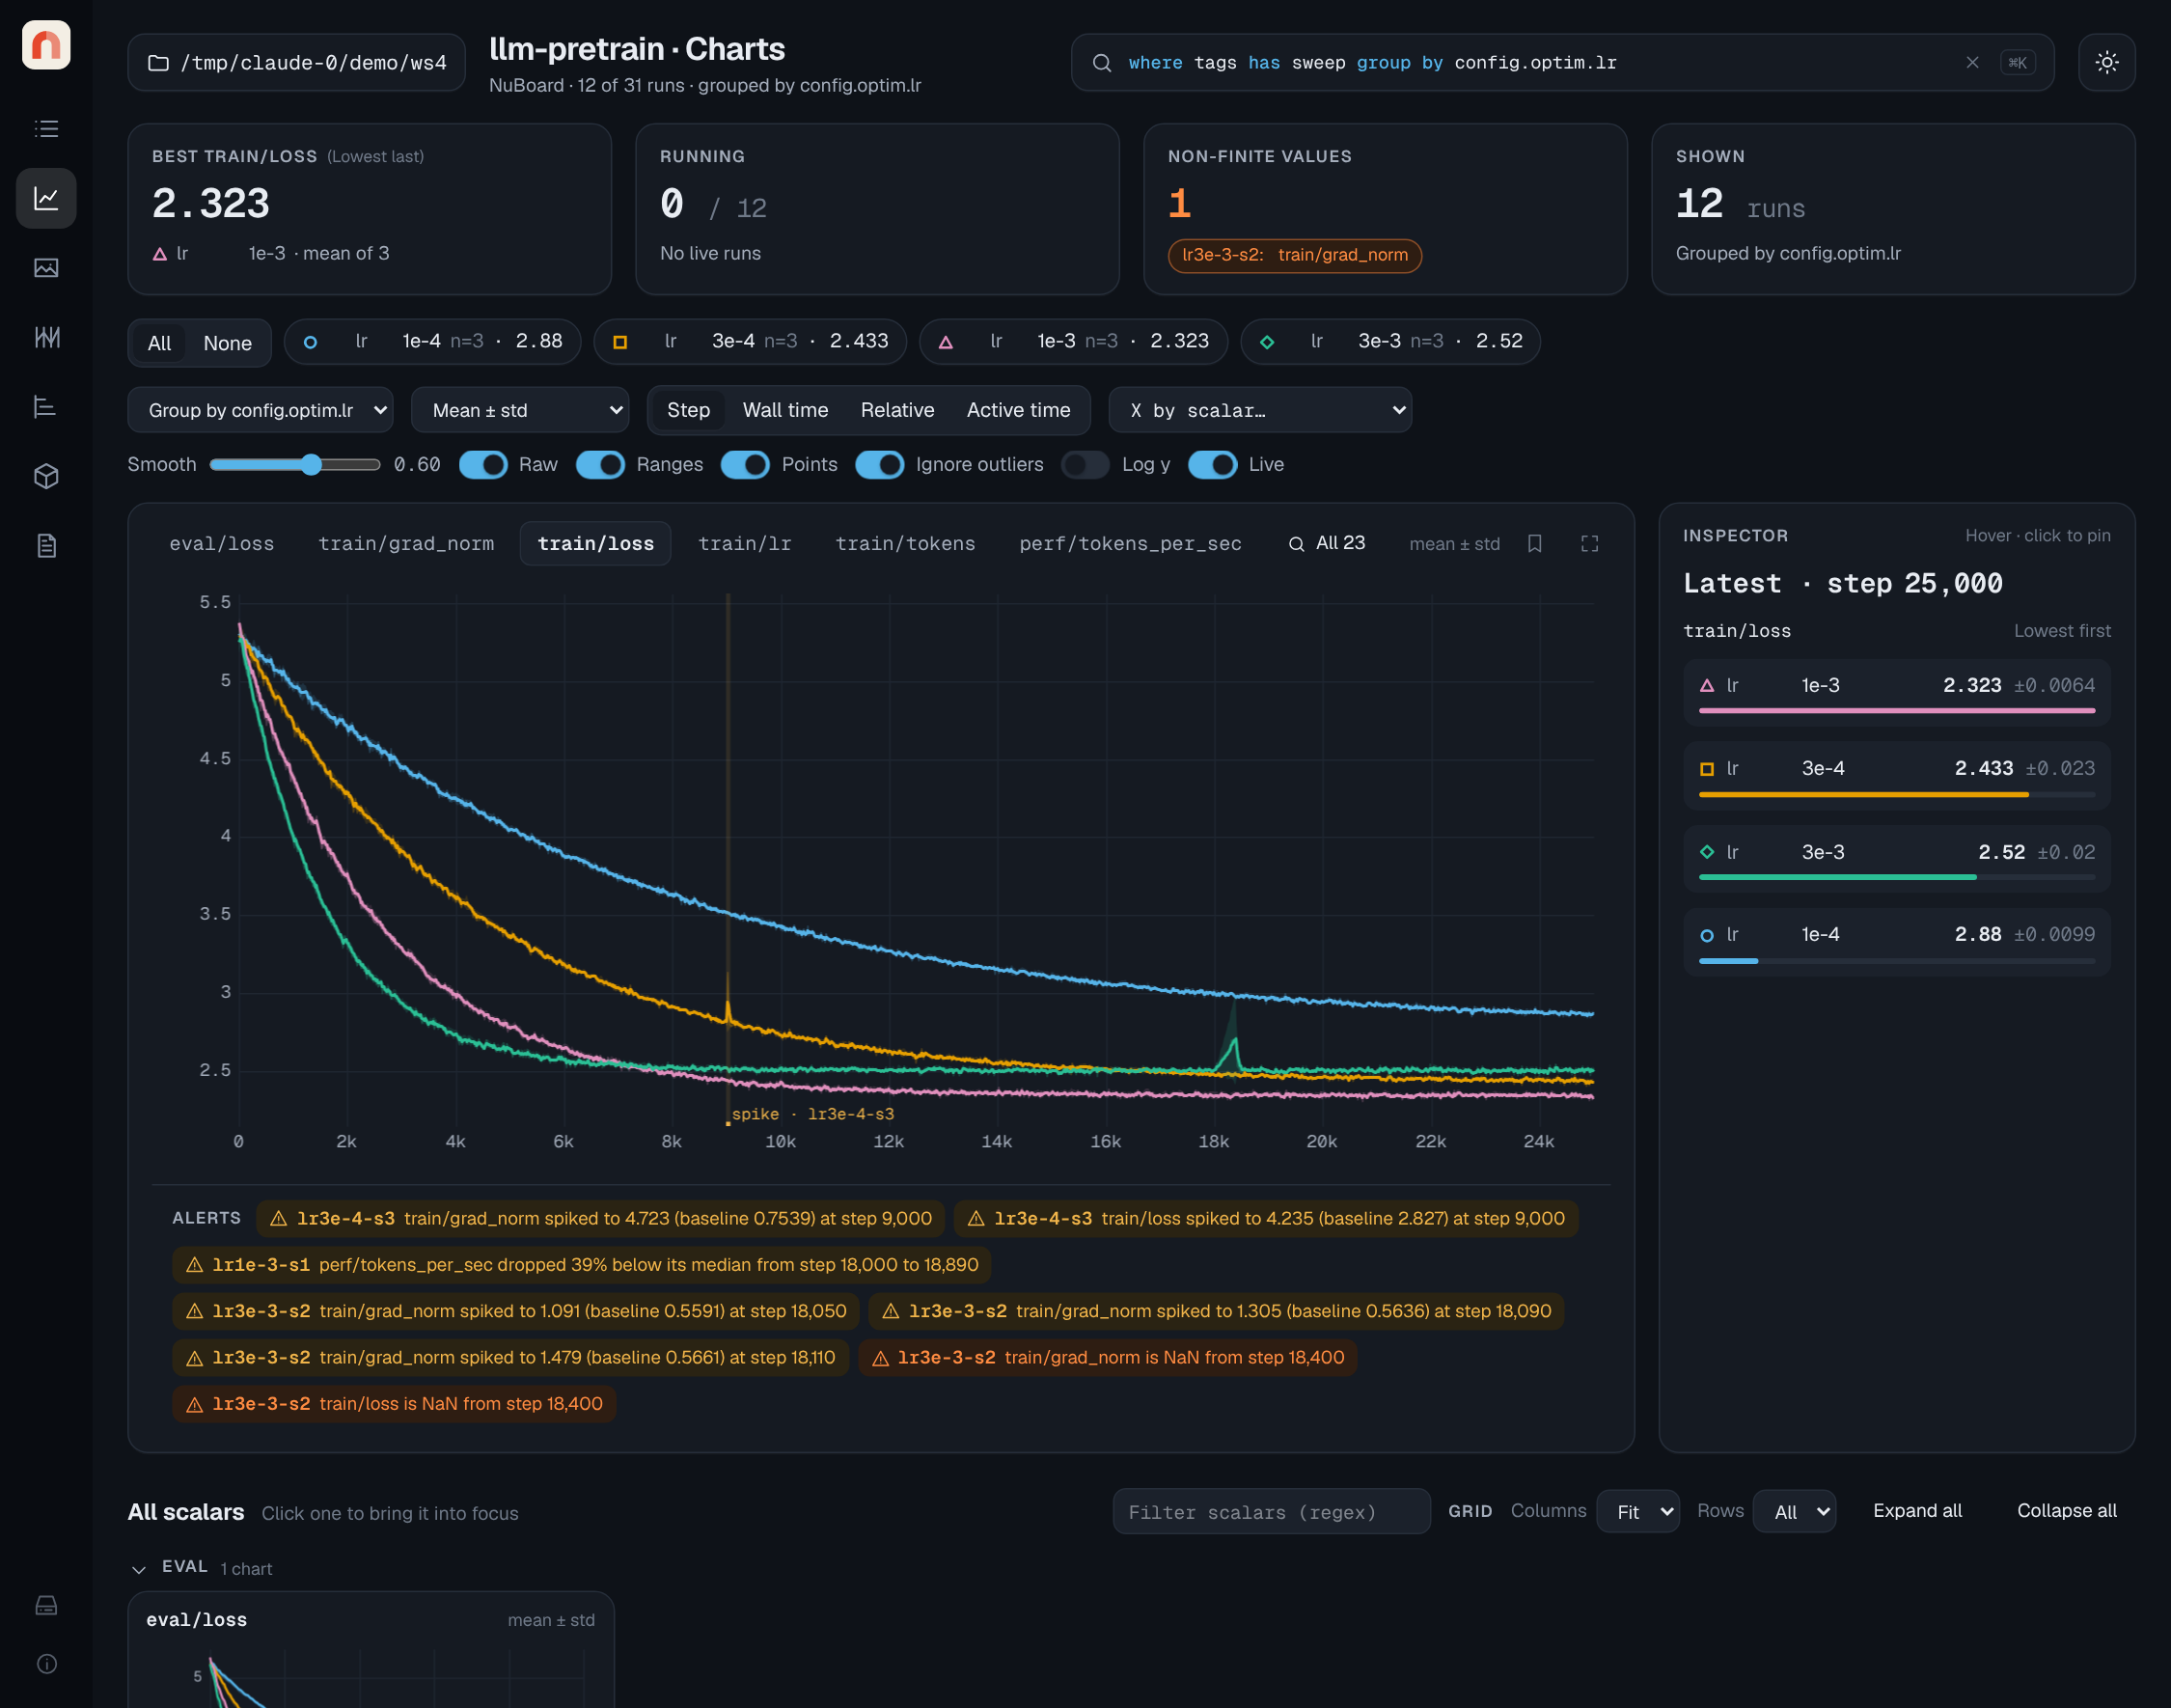
All your runs, one fast viewer. Group a sweep into mean ± std bands, smooth, zoom and catch NaNs and spikes while runs train.
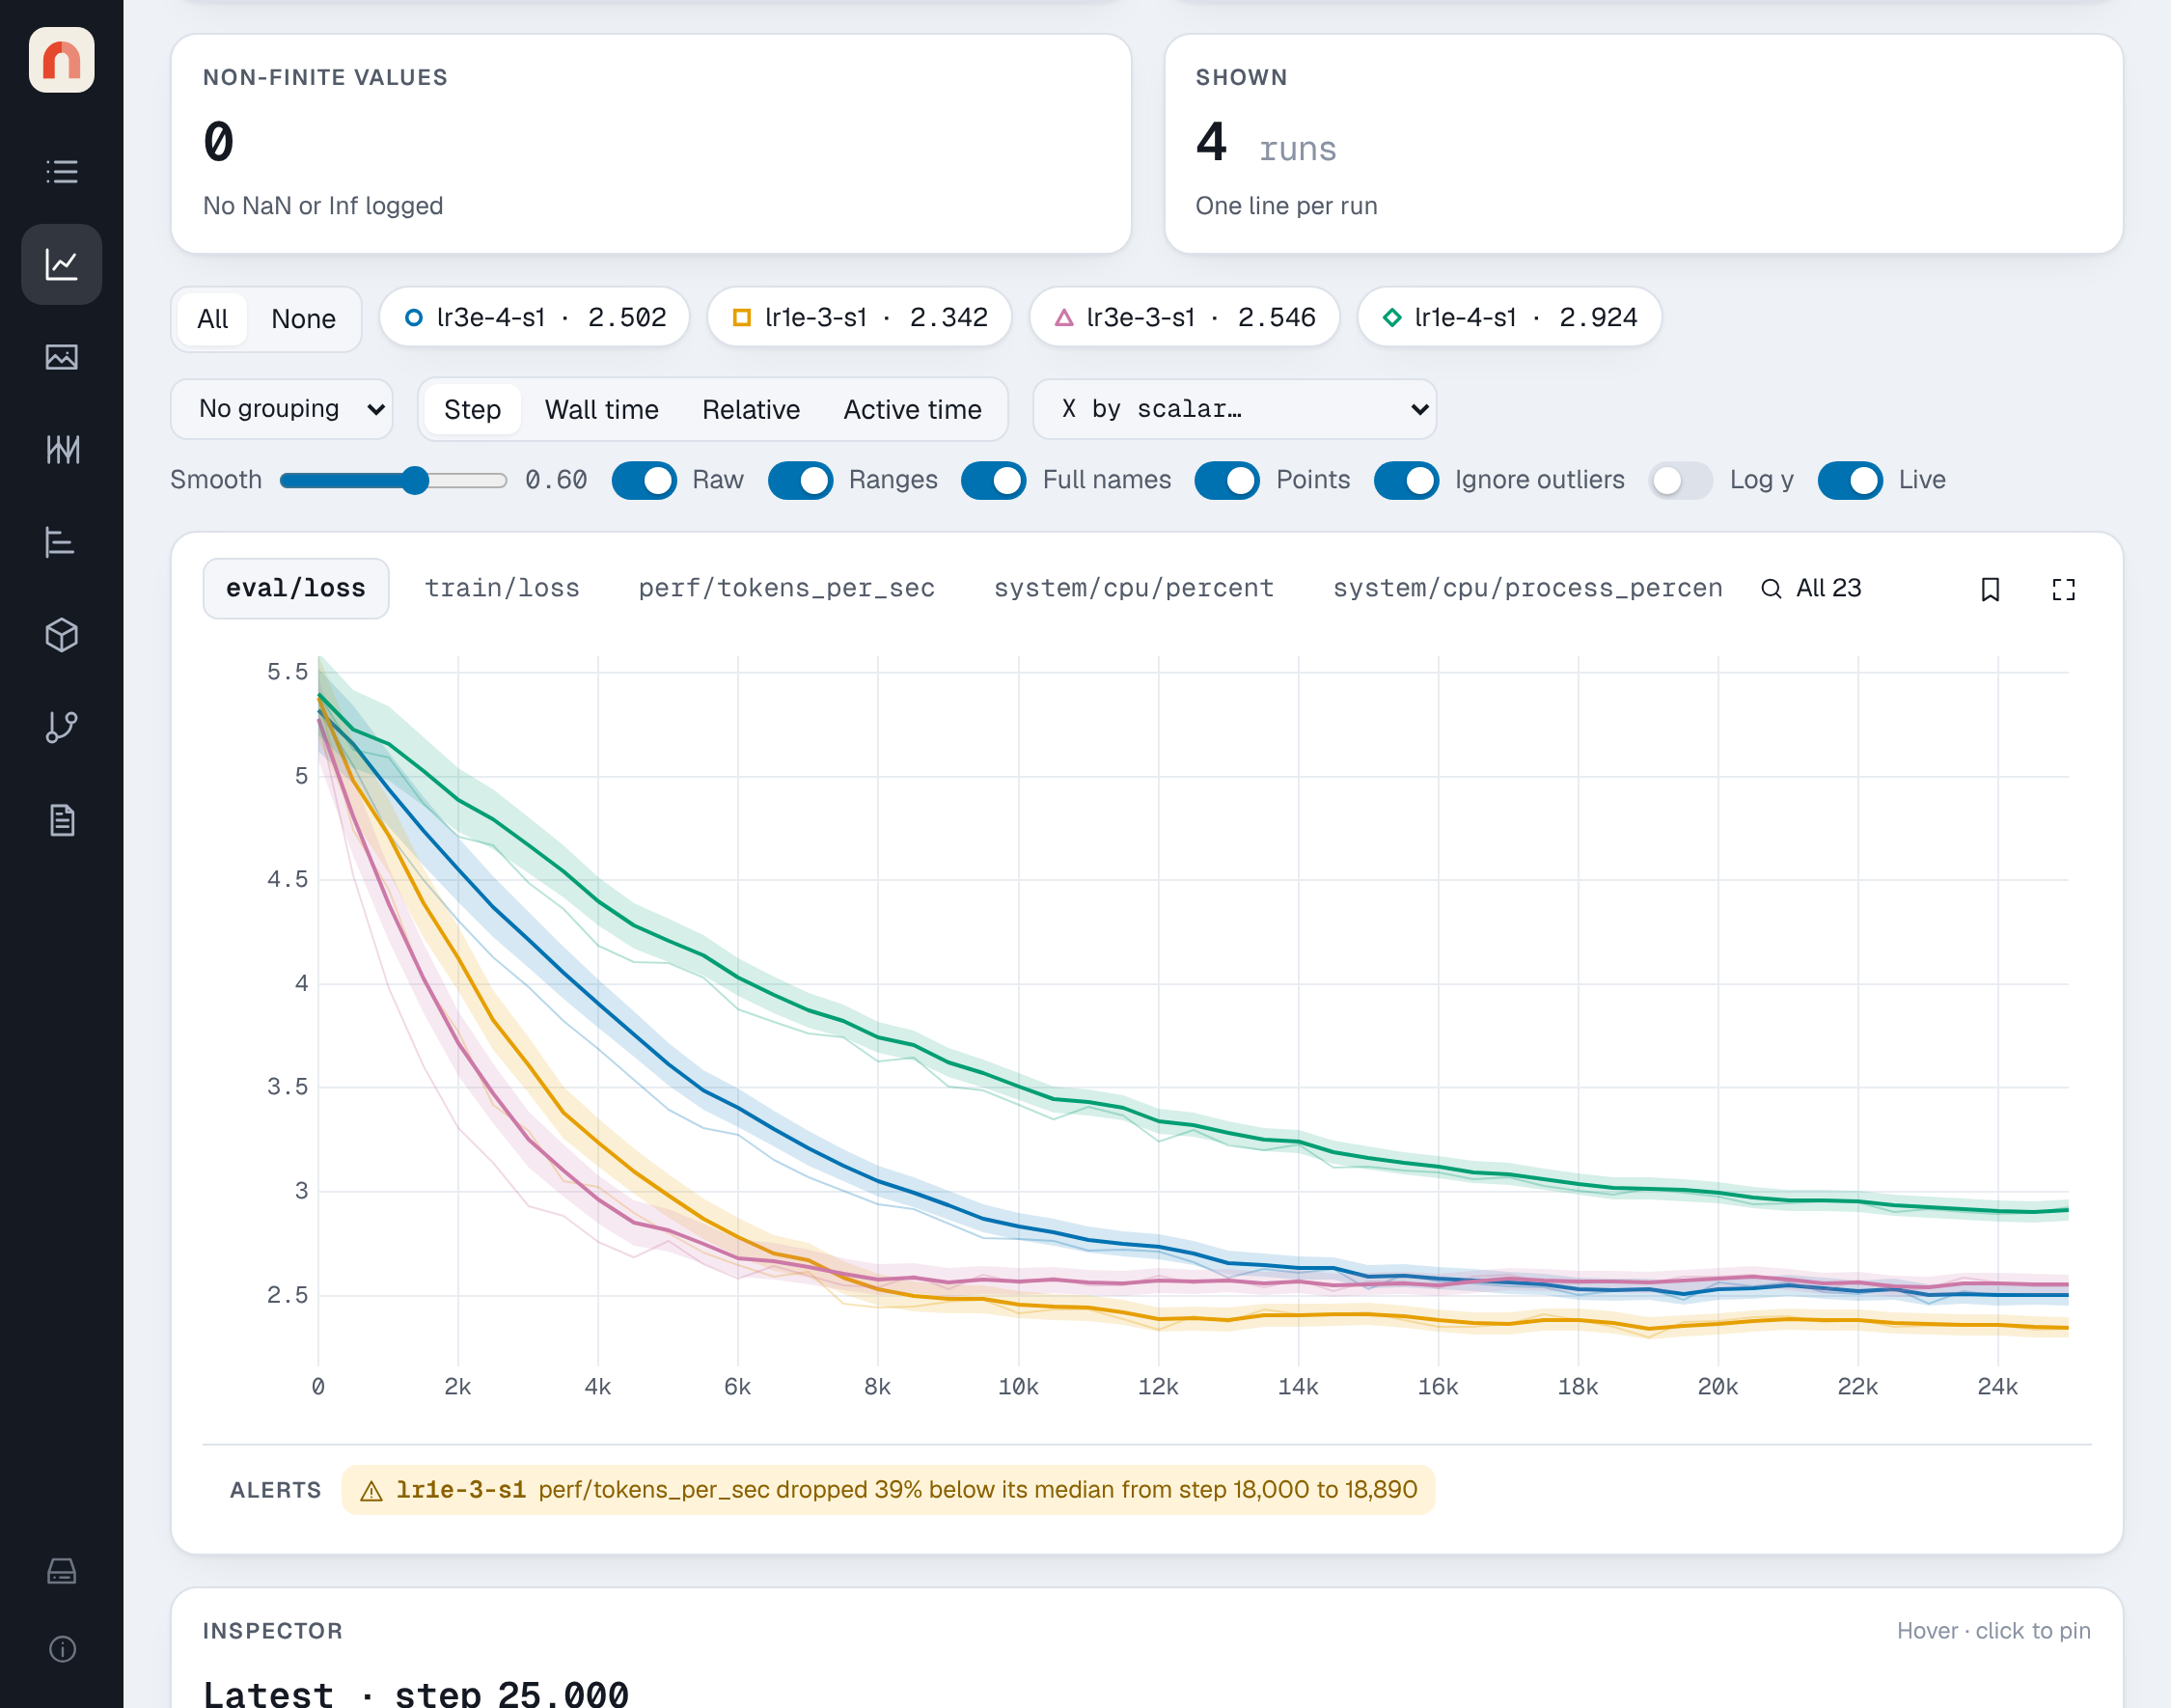
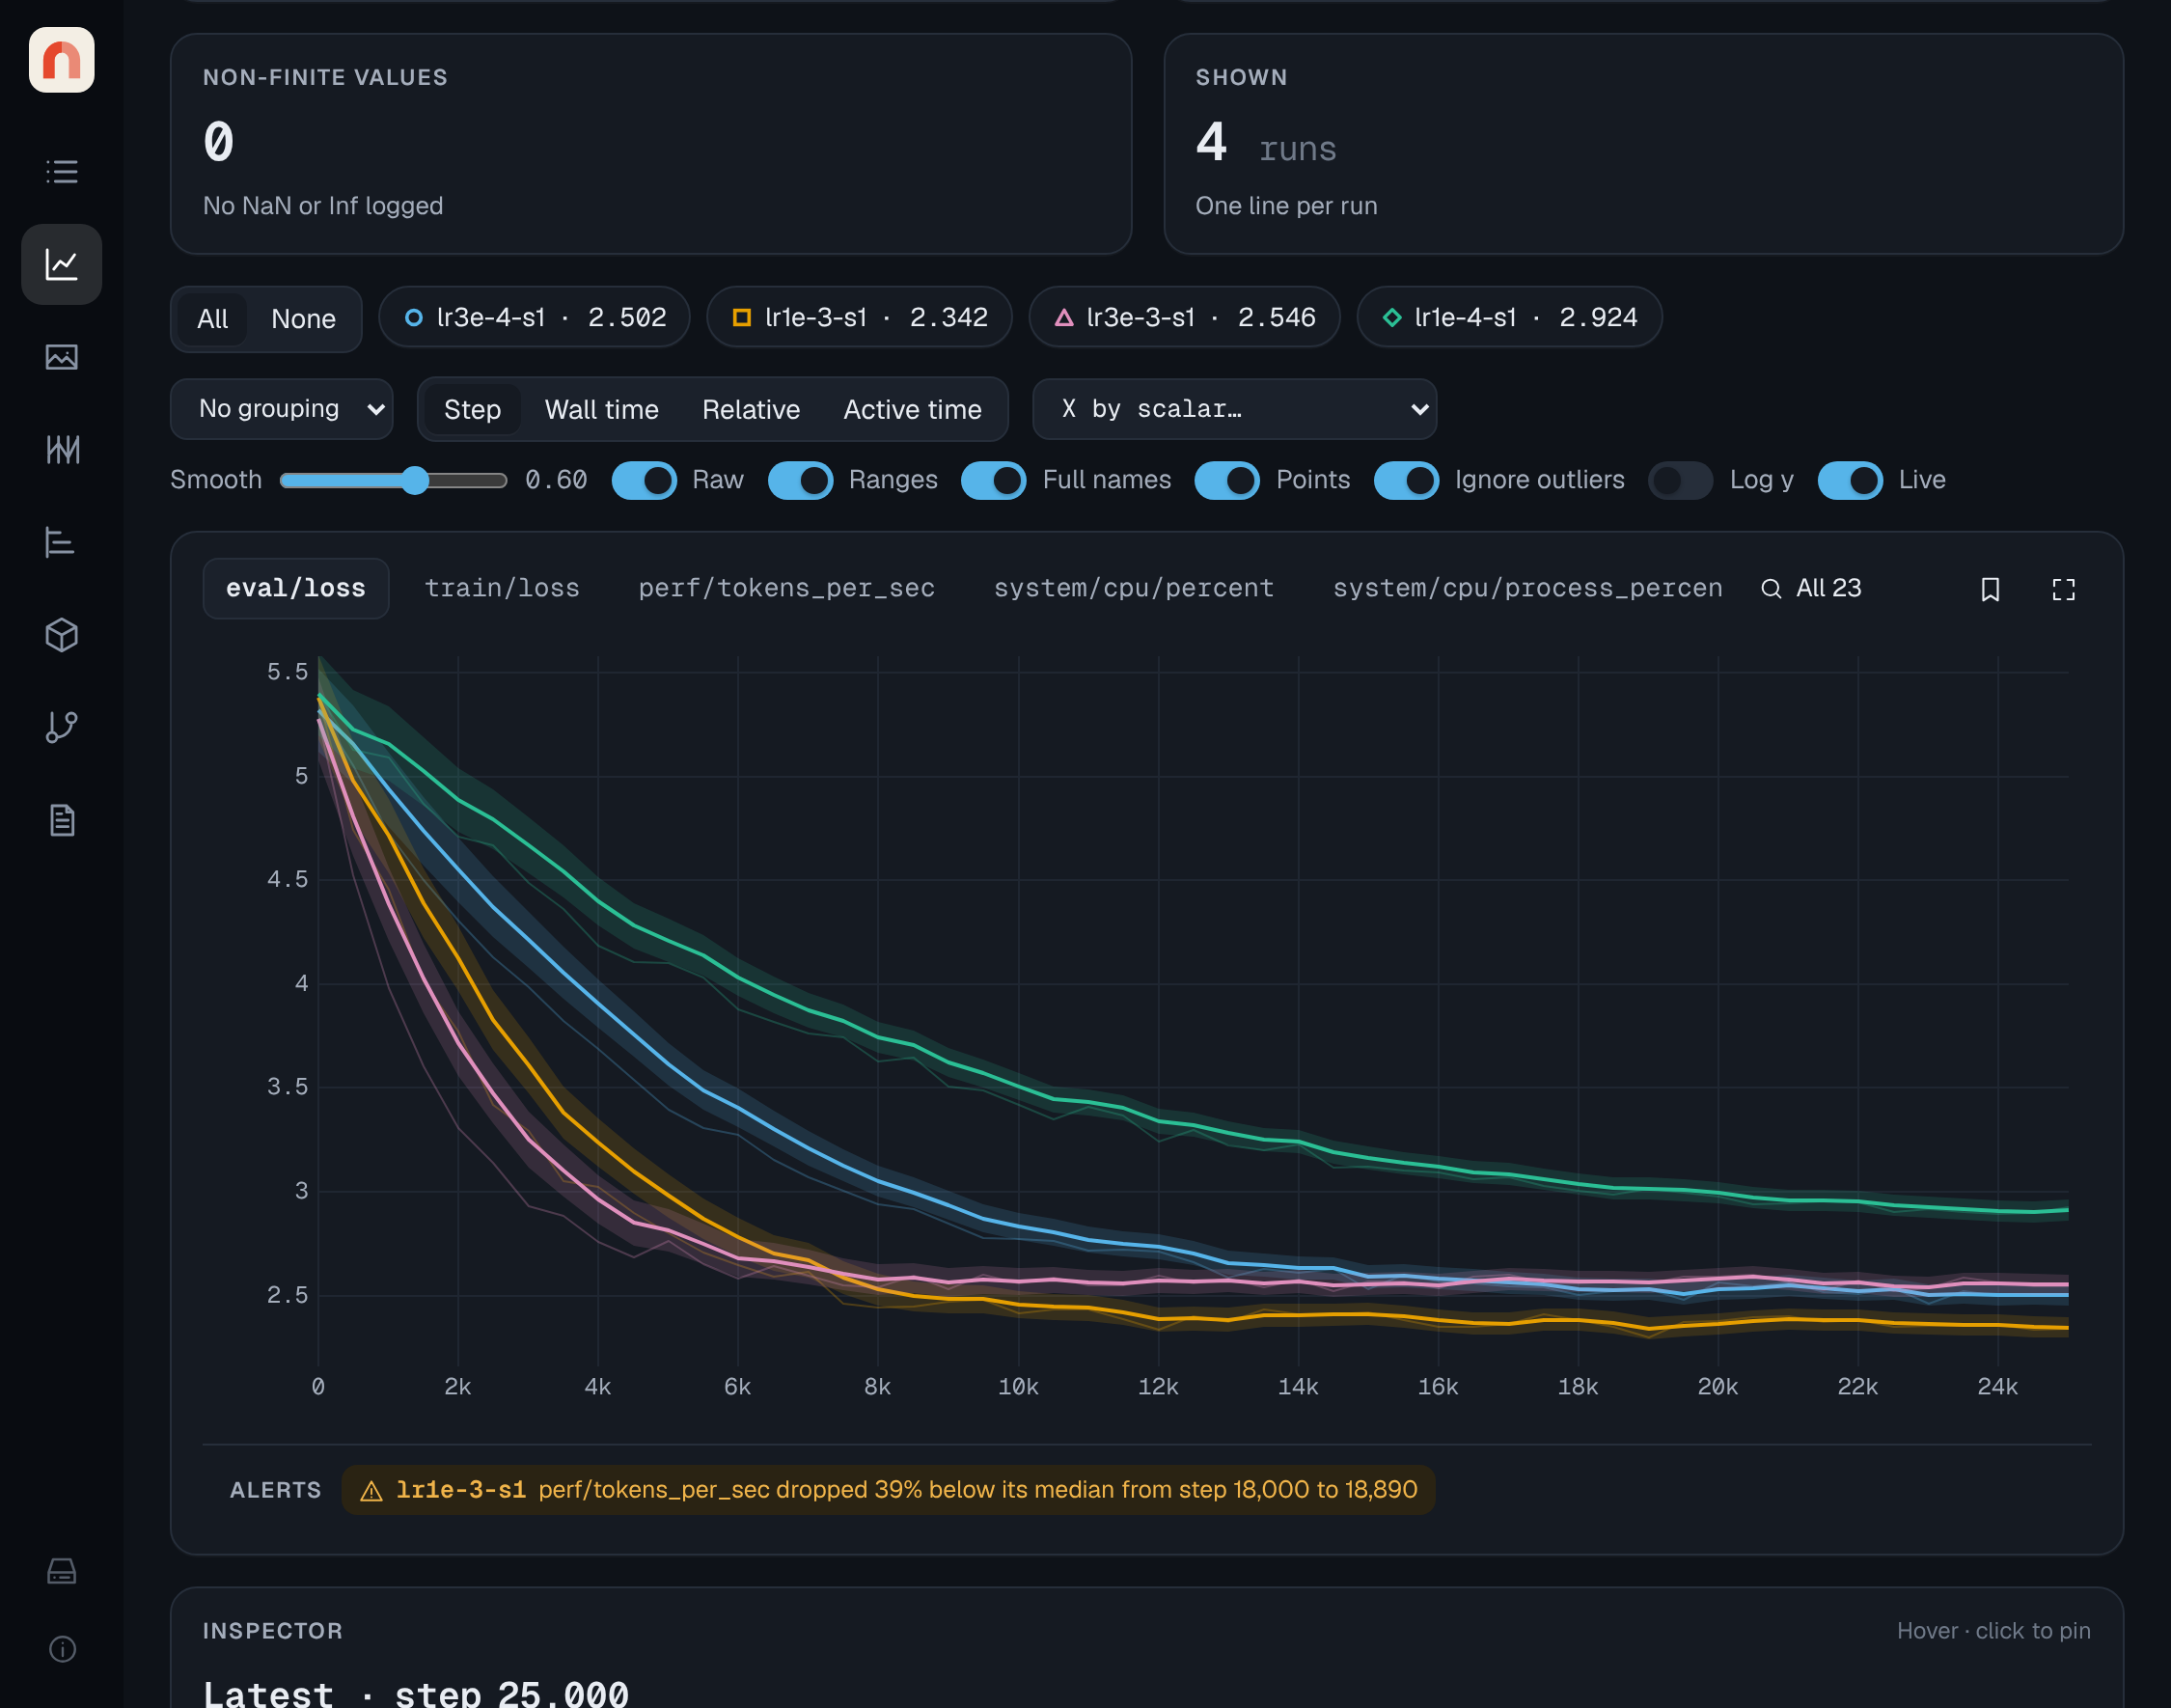
Log a range, not just a number. Give add_scalar a low and high and each run gets its own shaded band, such as ± std over evaluation batches.
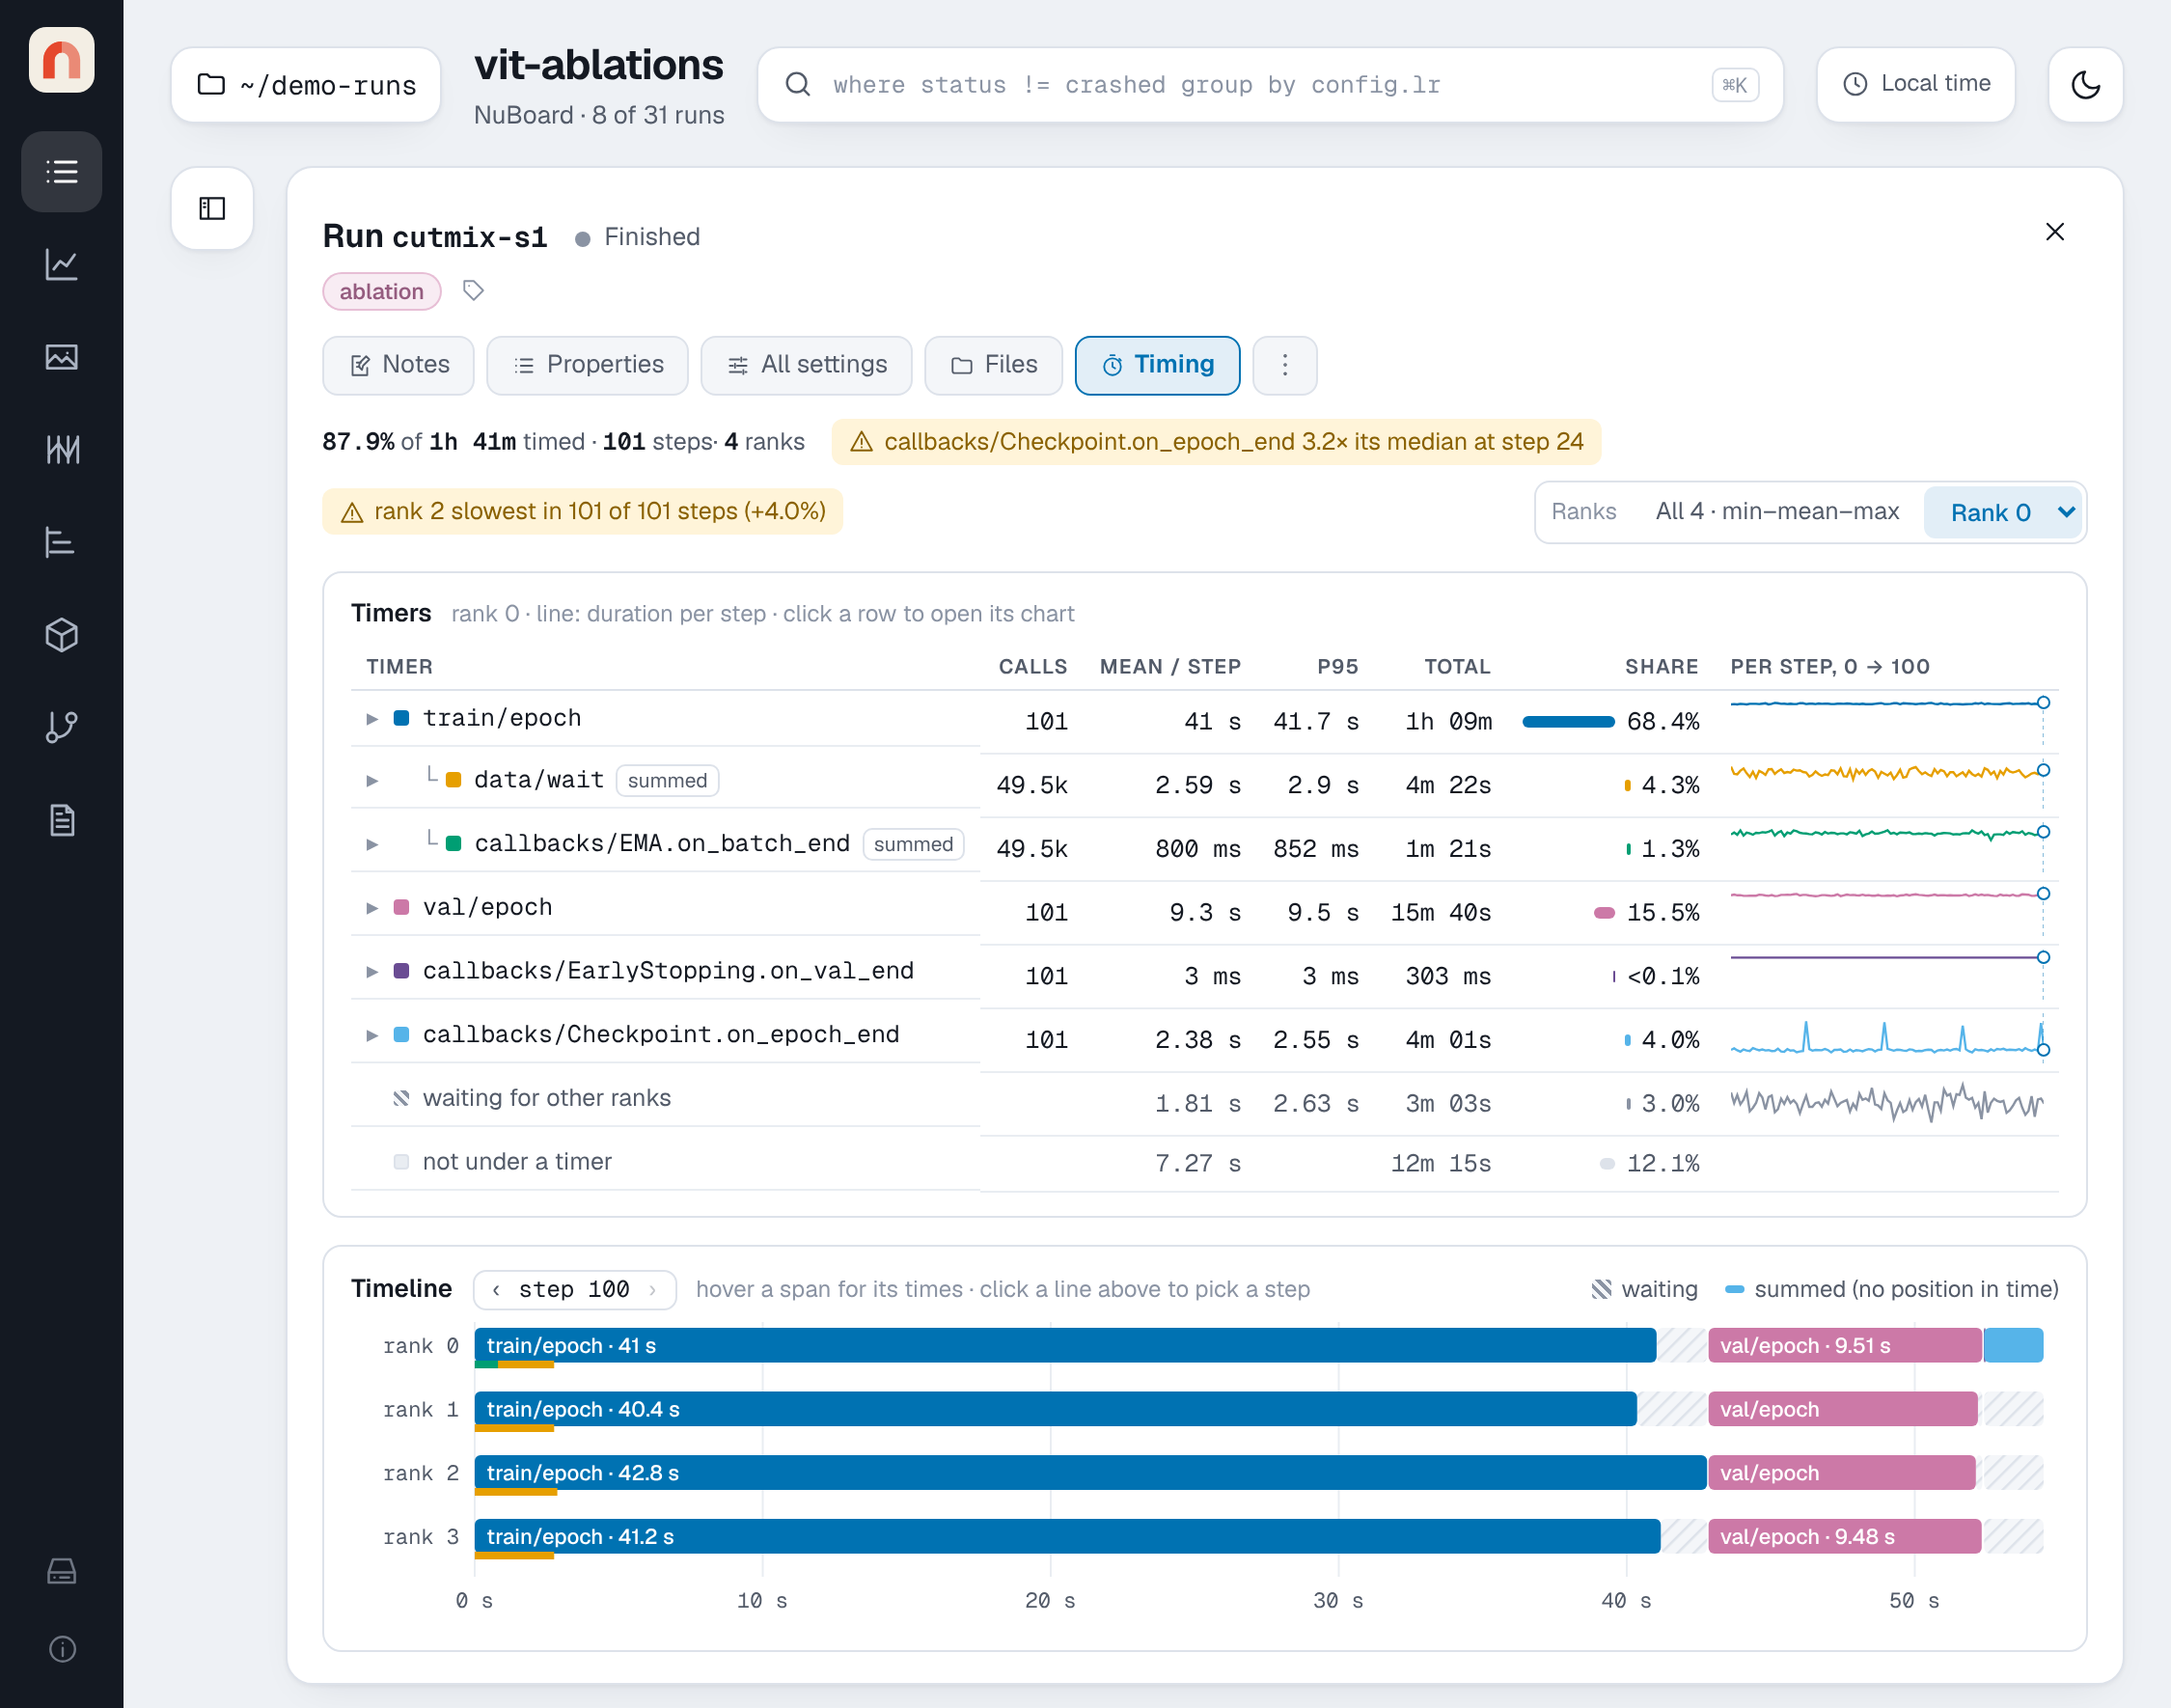
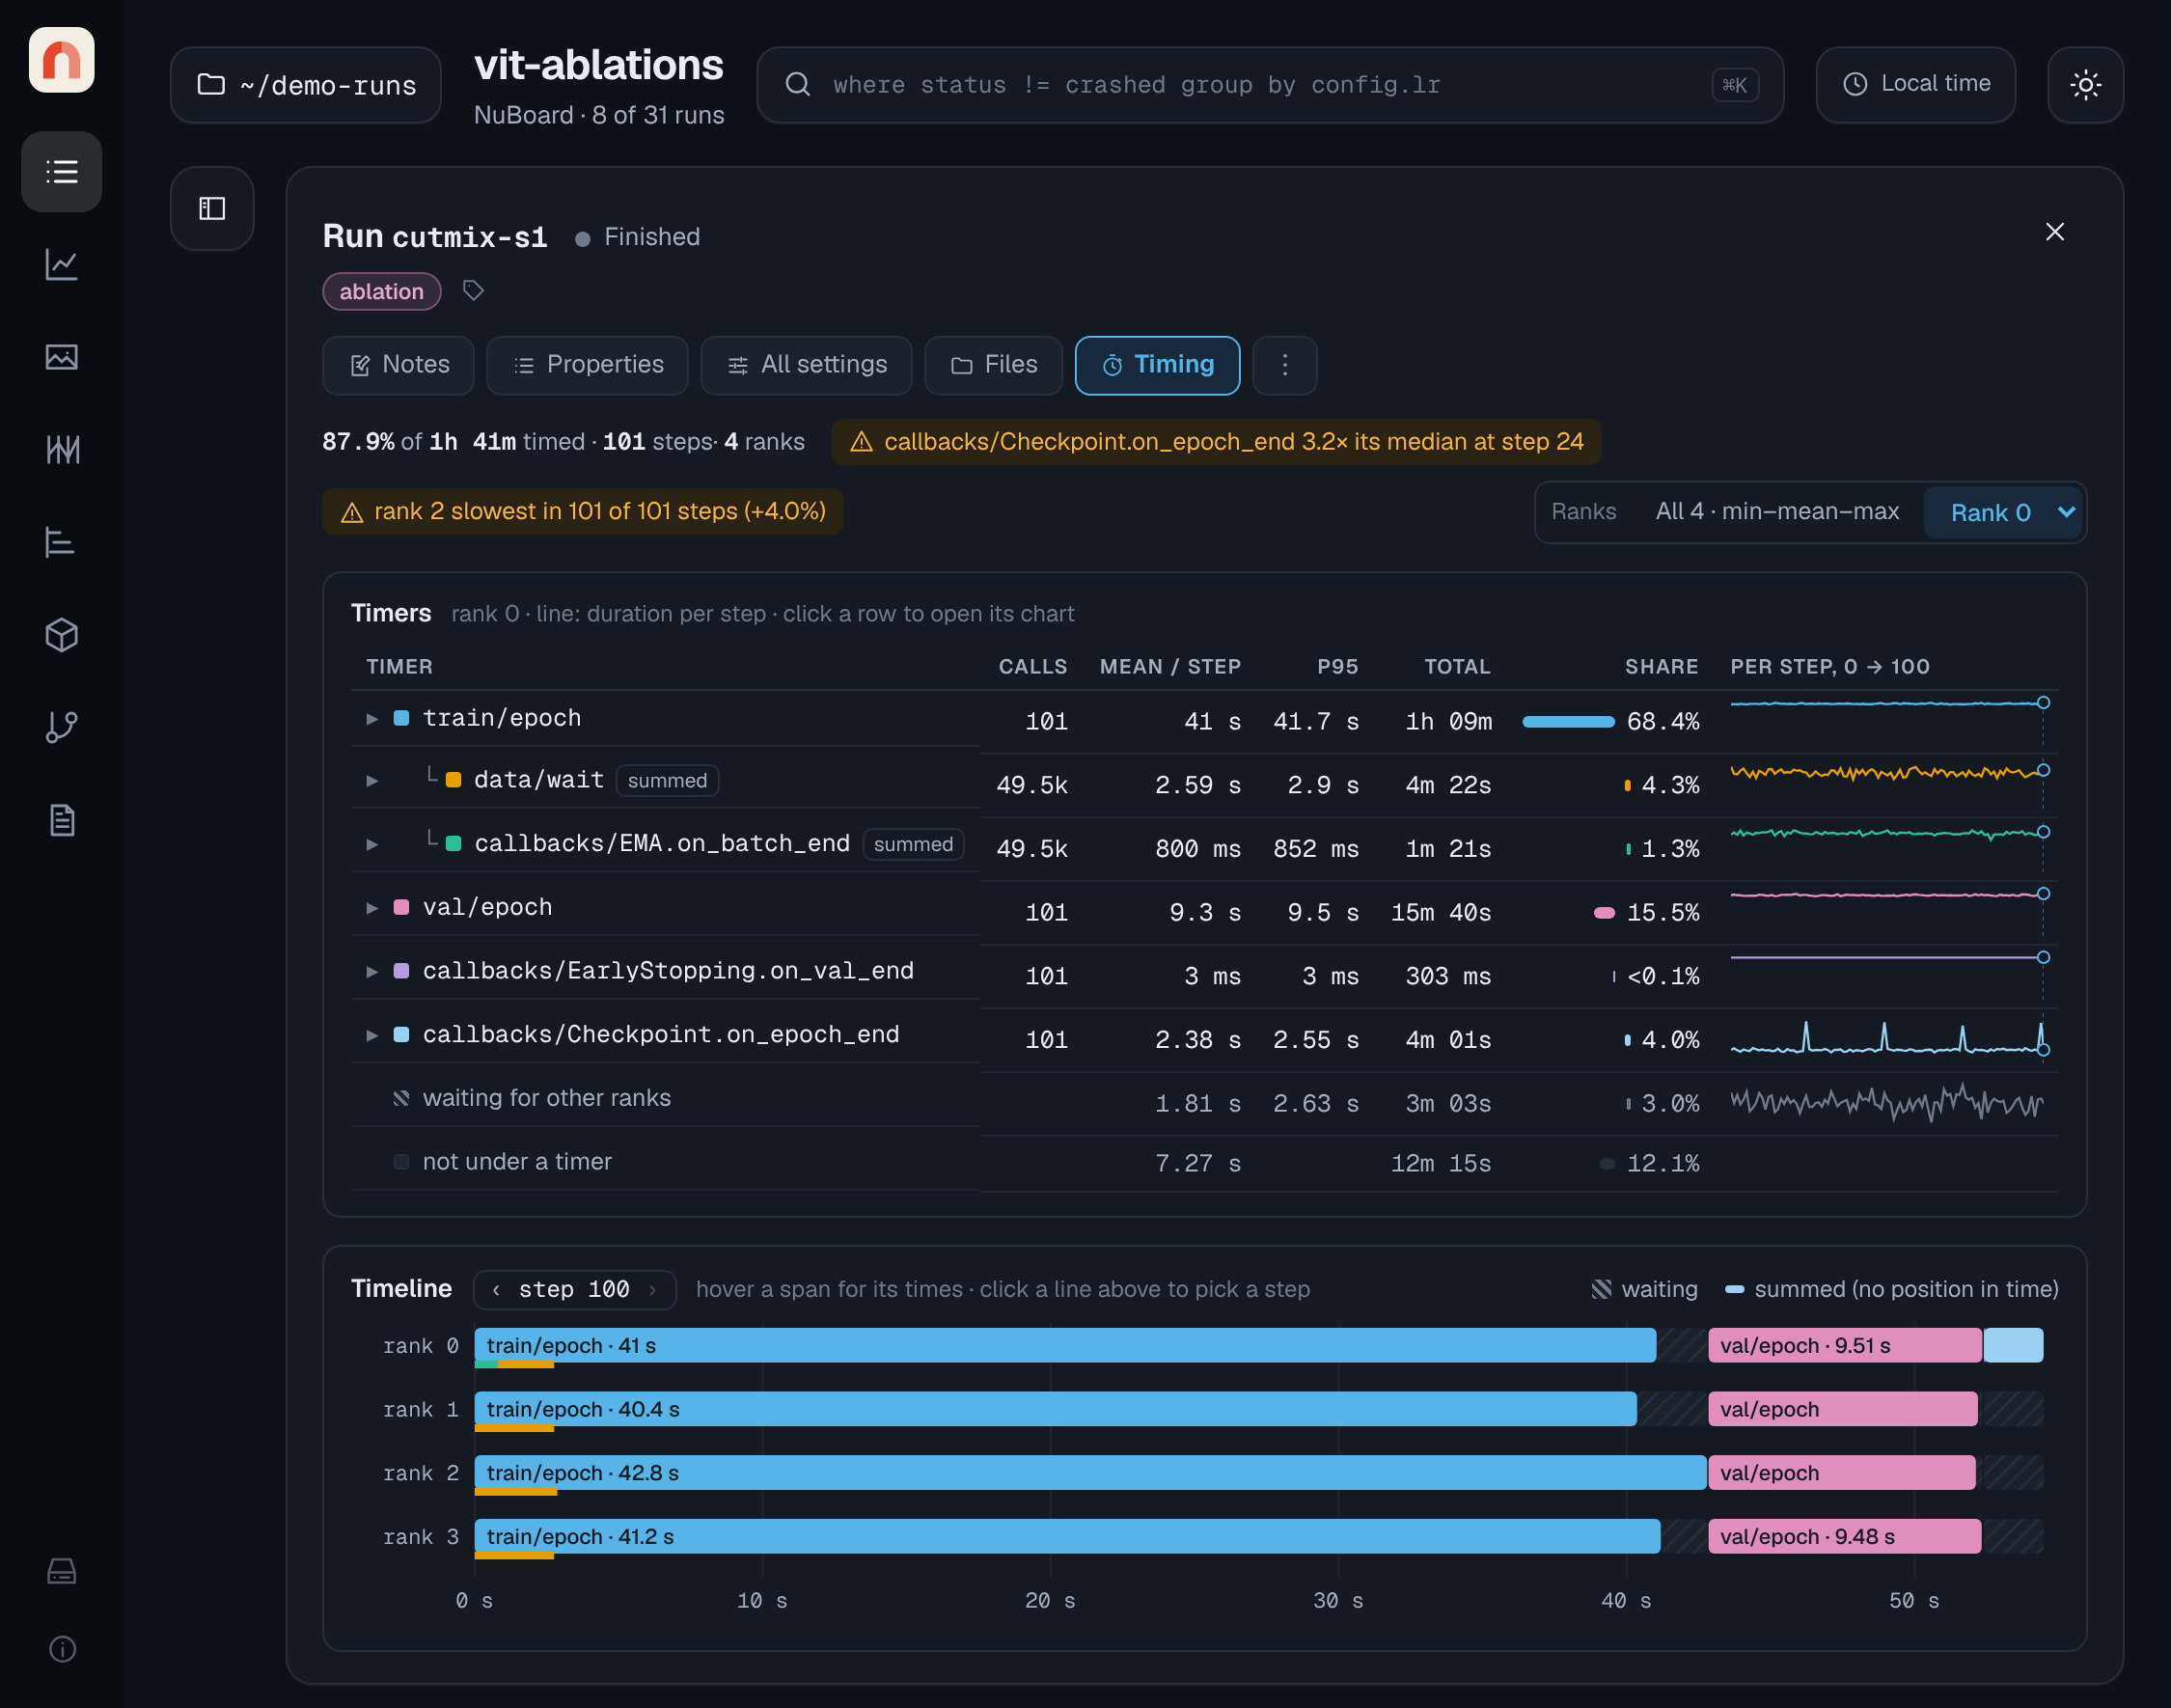
See where the time goes. Wrap training and validation in run.timer: mean and p95 per step, slow outliers, and which rank everyone waited for.
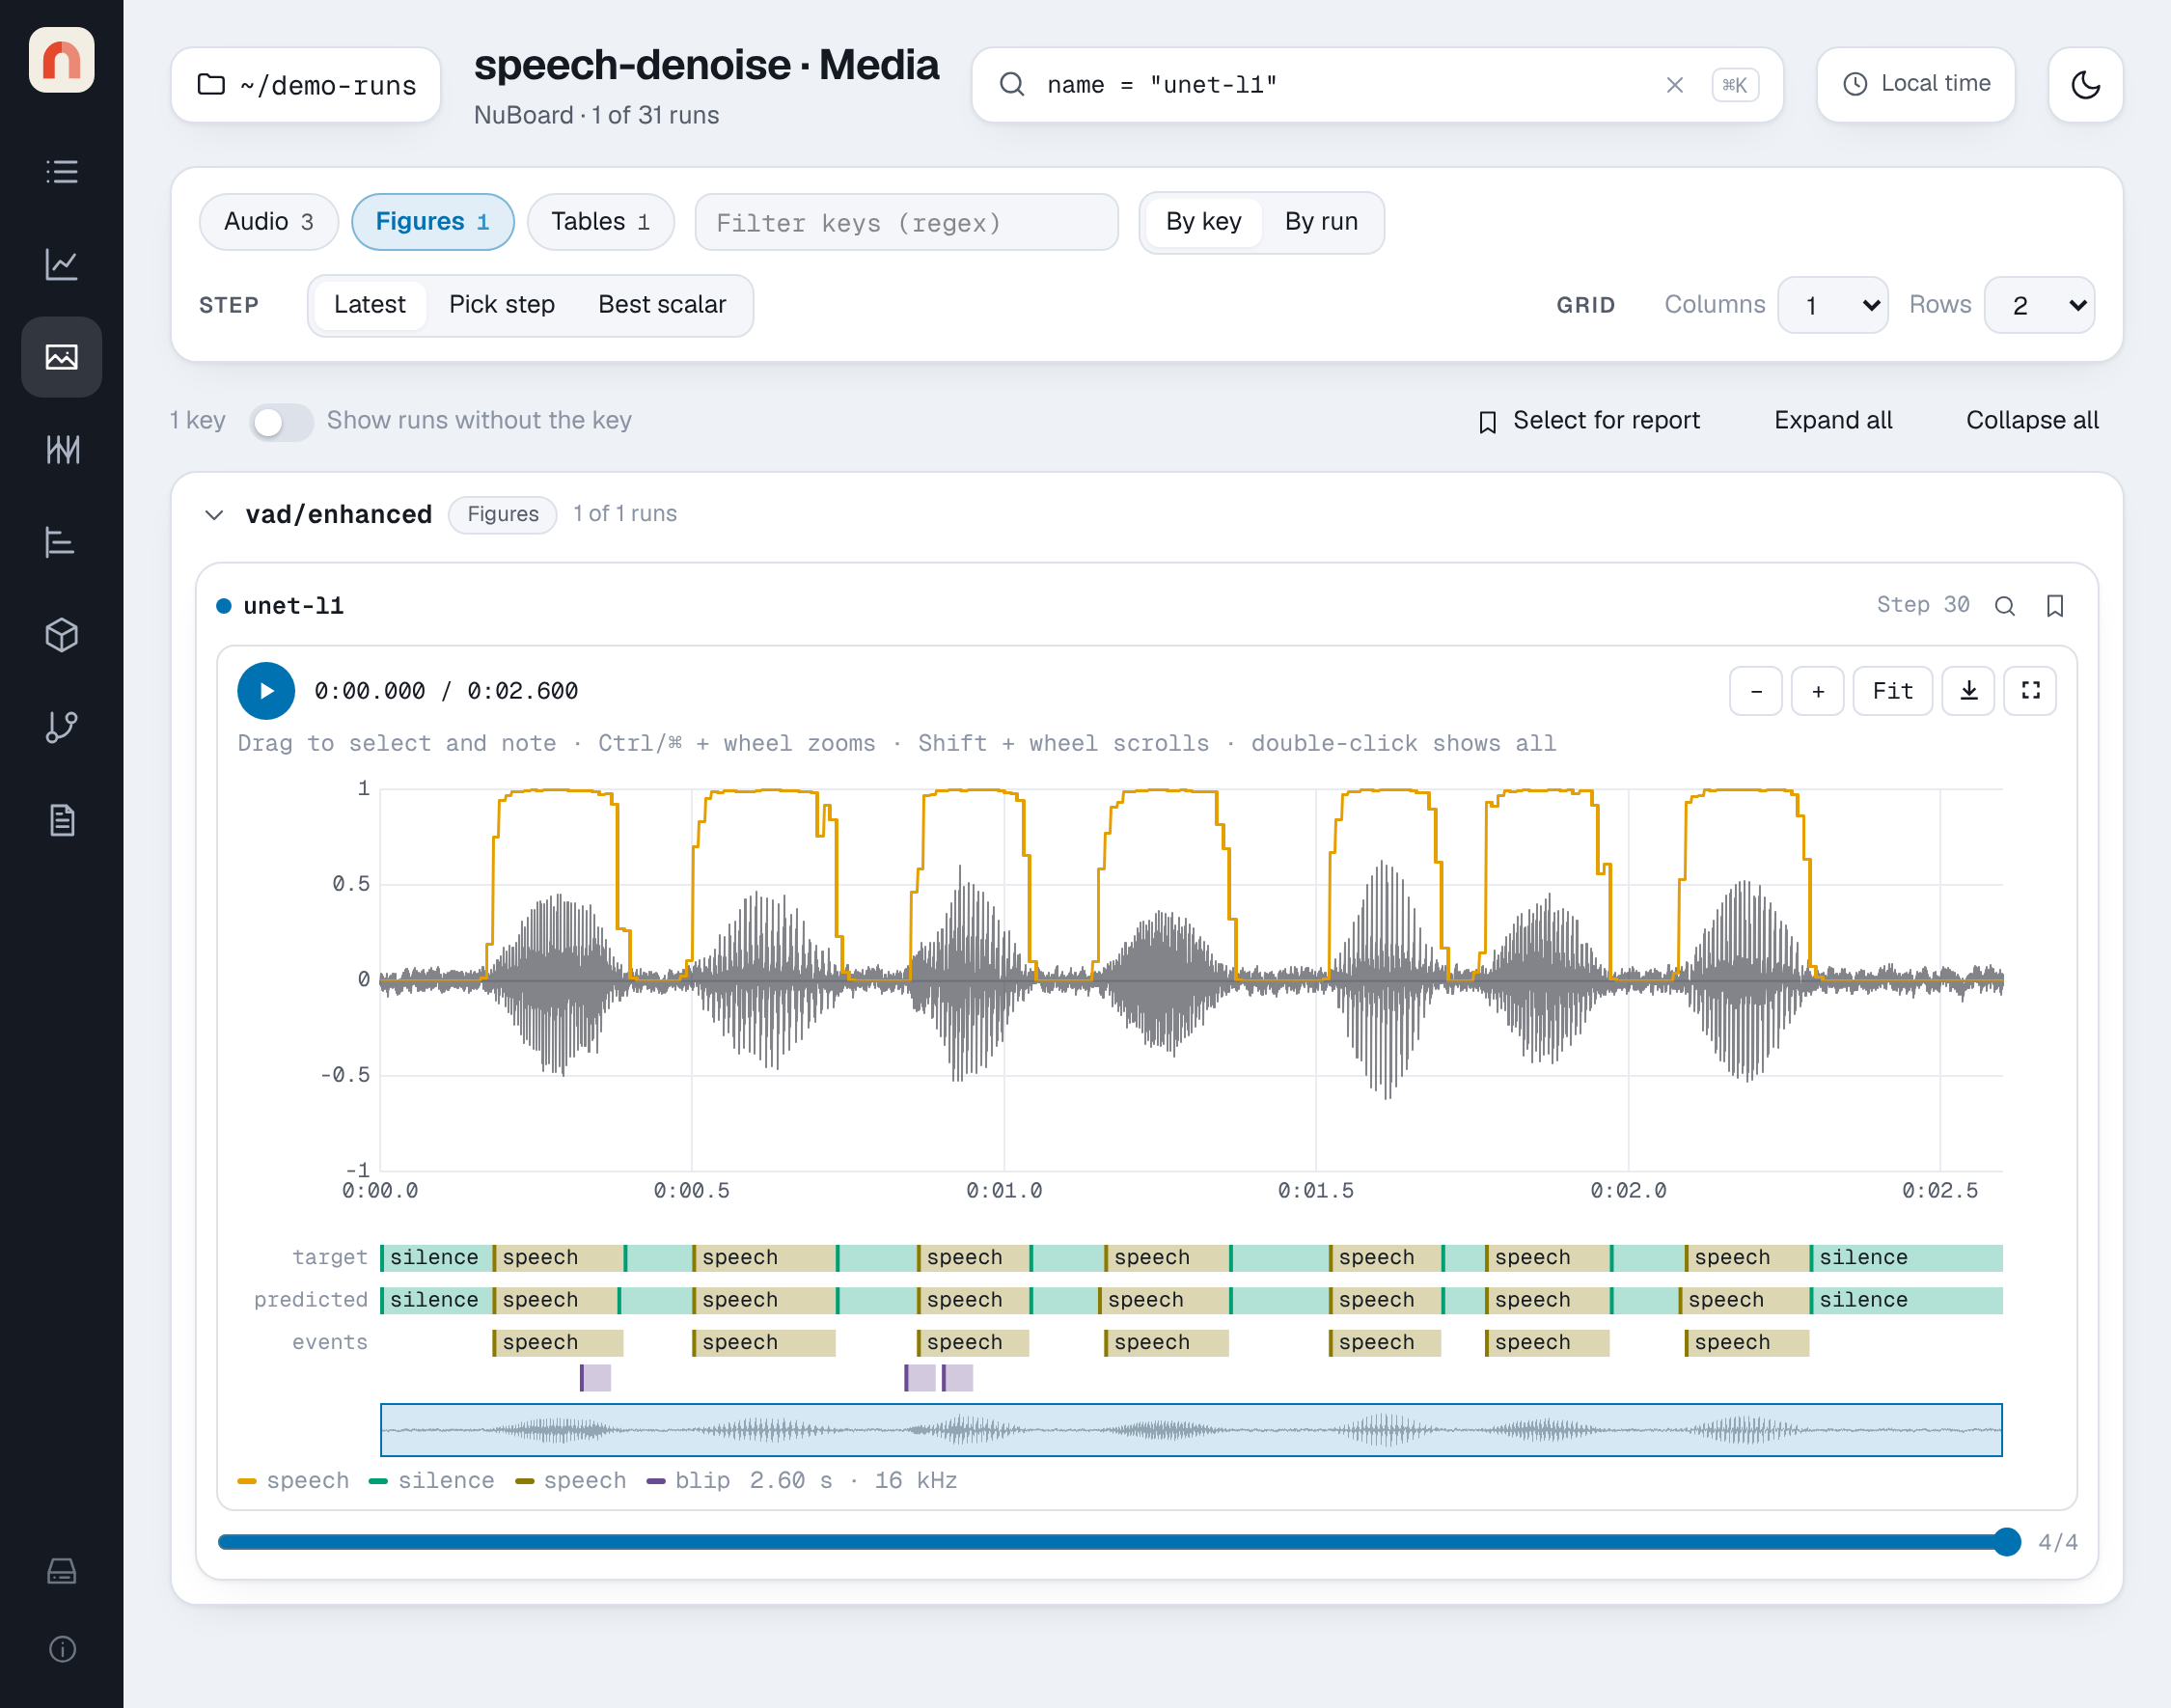
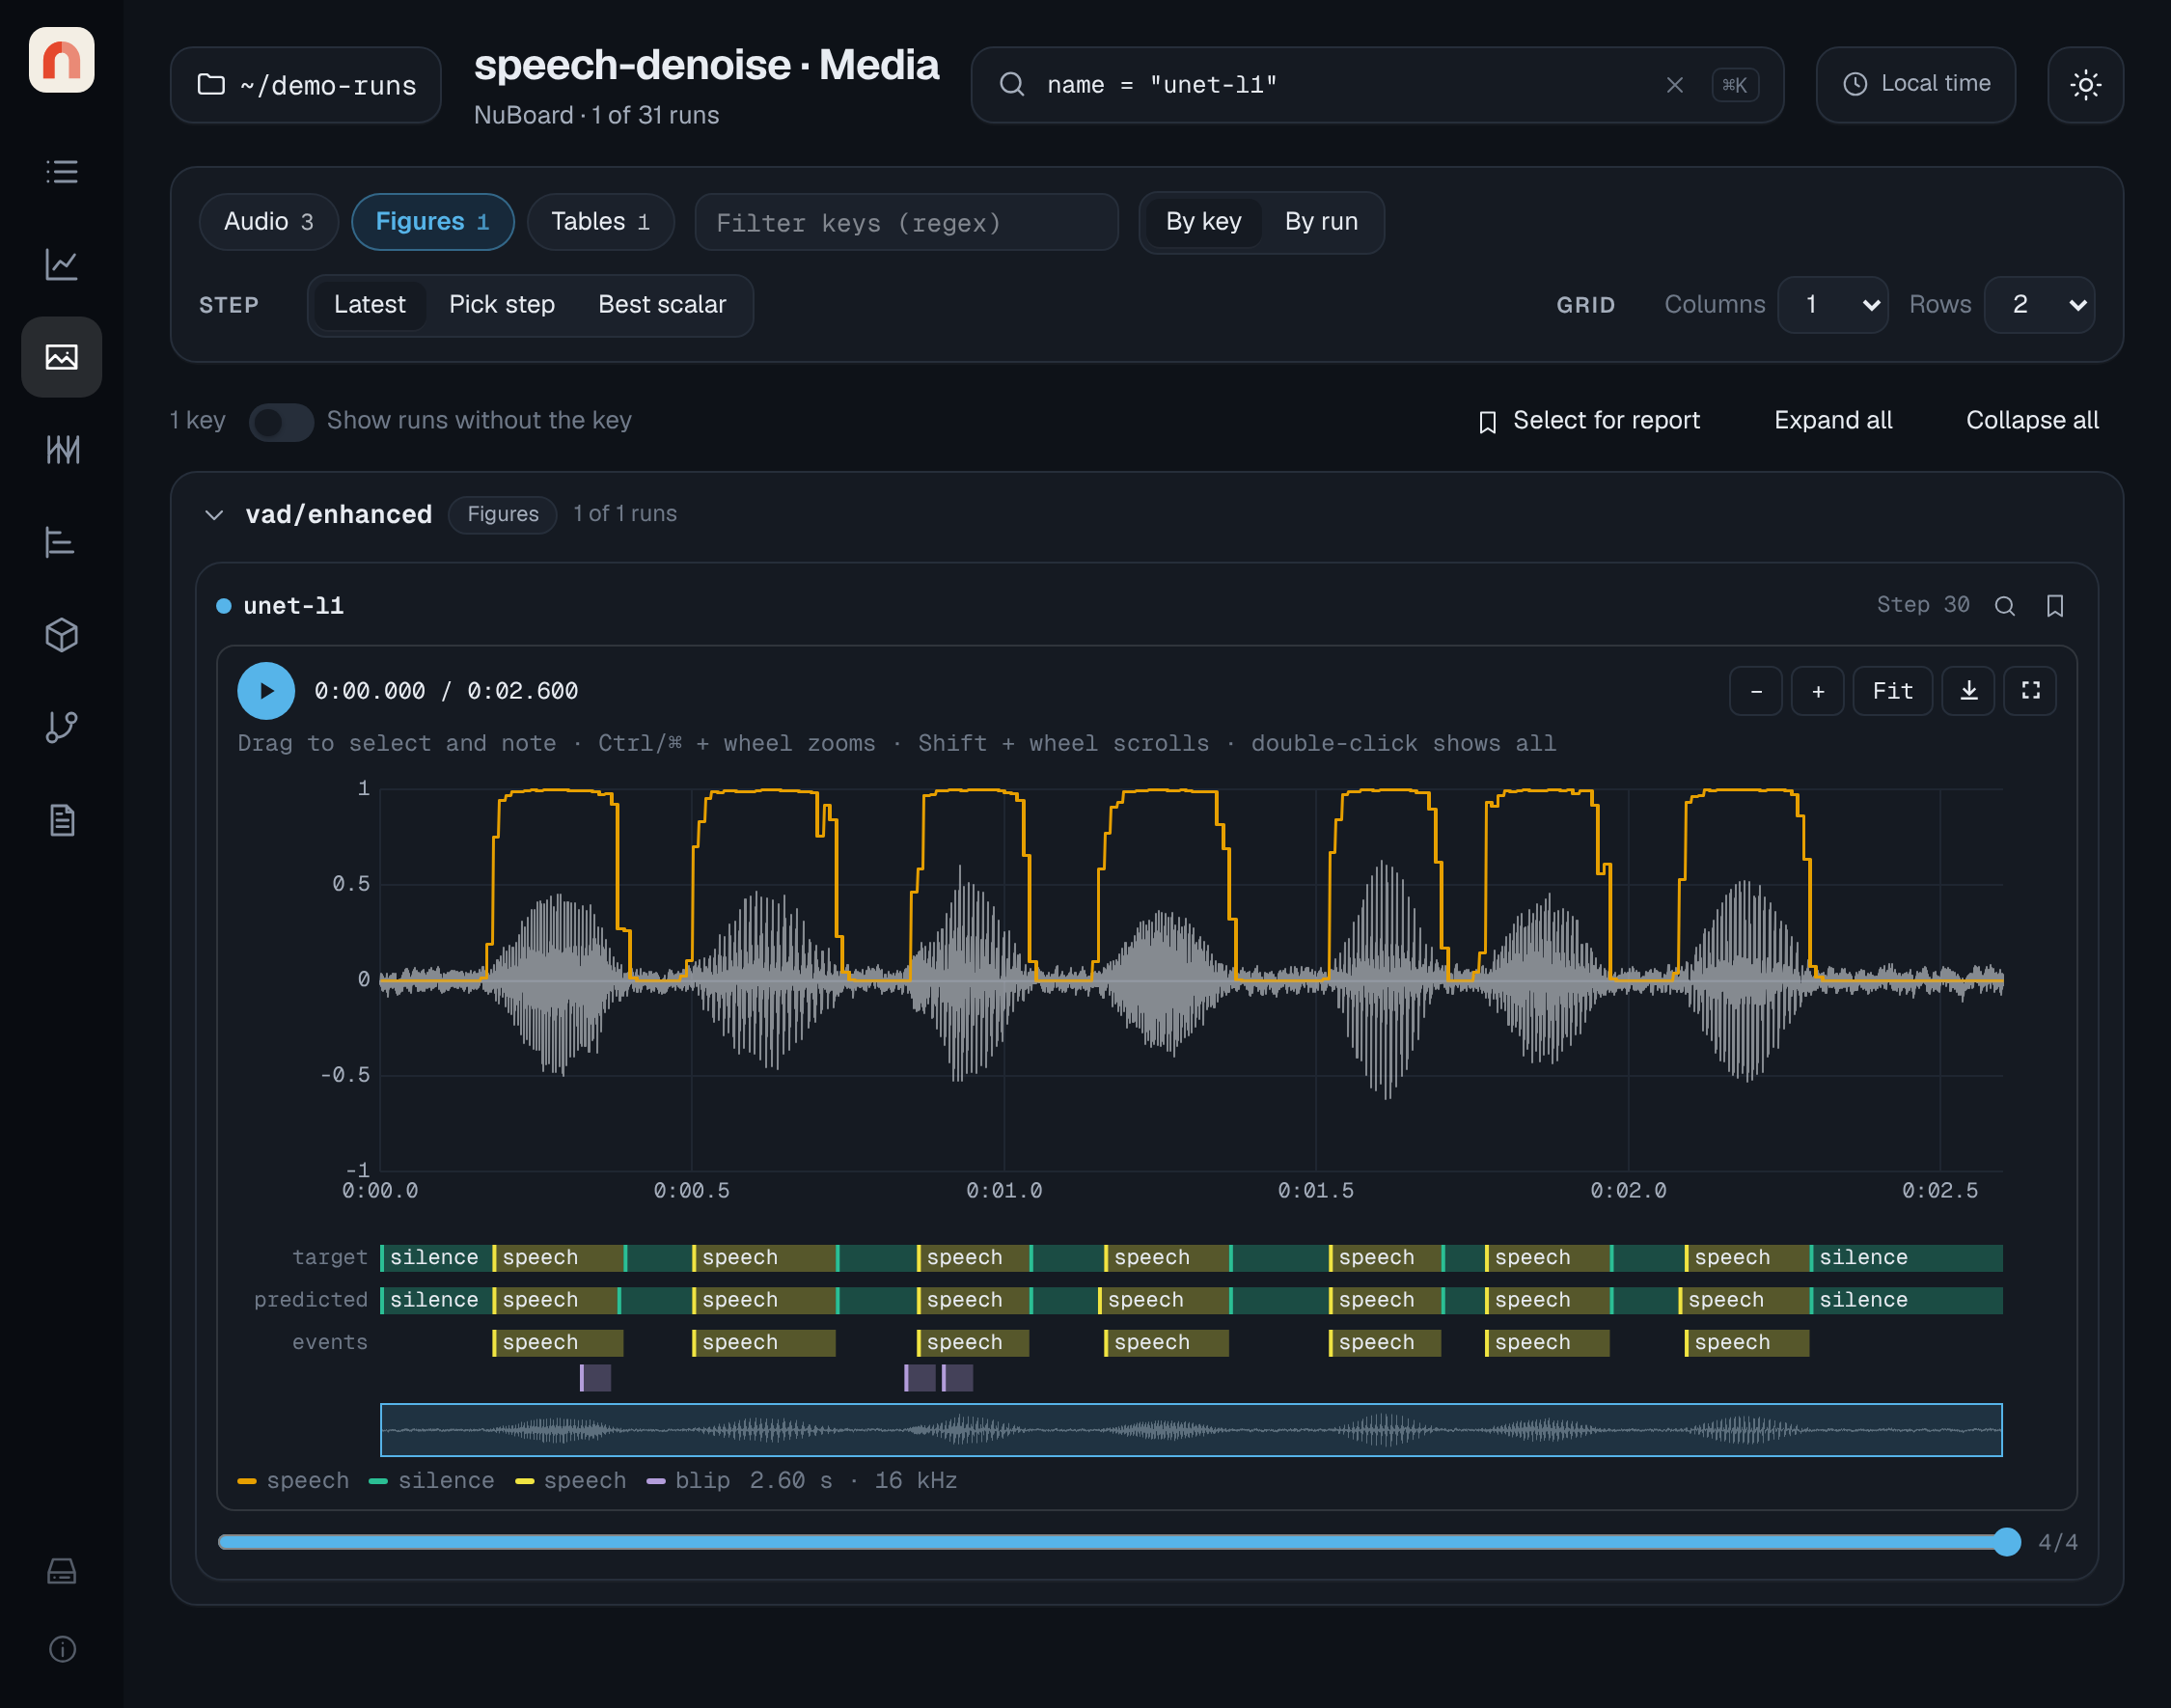
Audio with its annotations. Overlay a voice activity probability and label tracks on the waveform, then play, zoom and leave notes on any region.
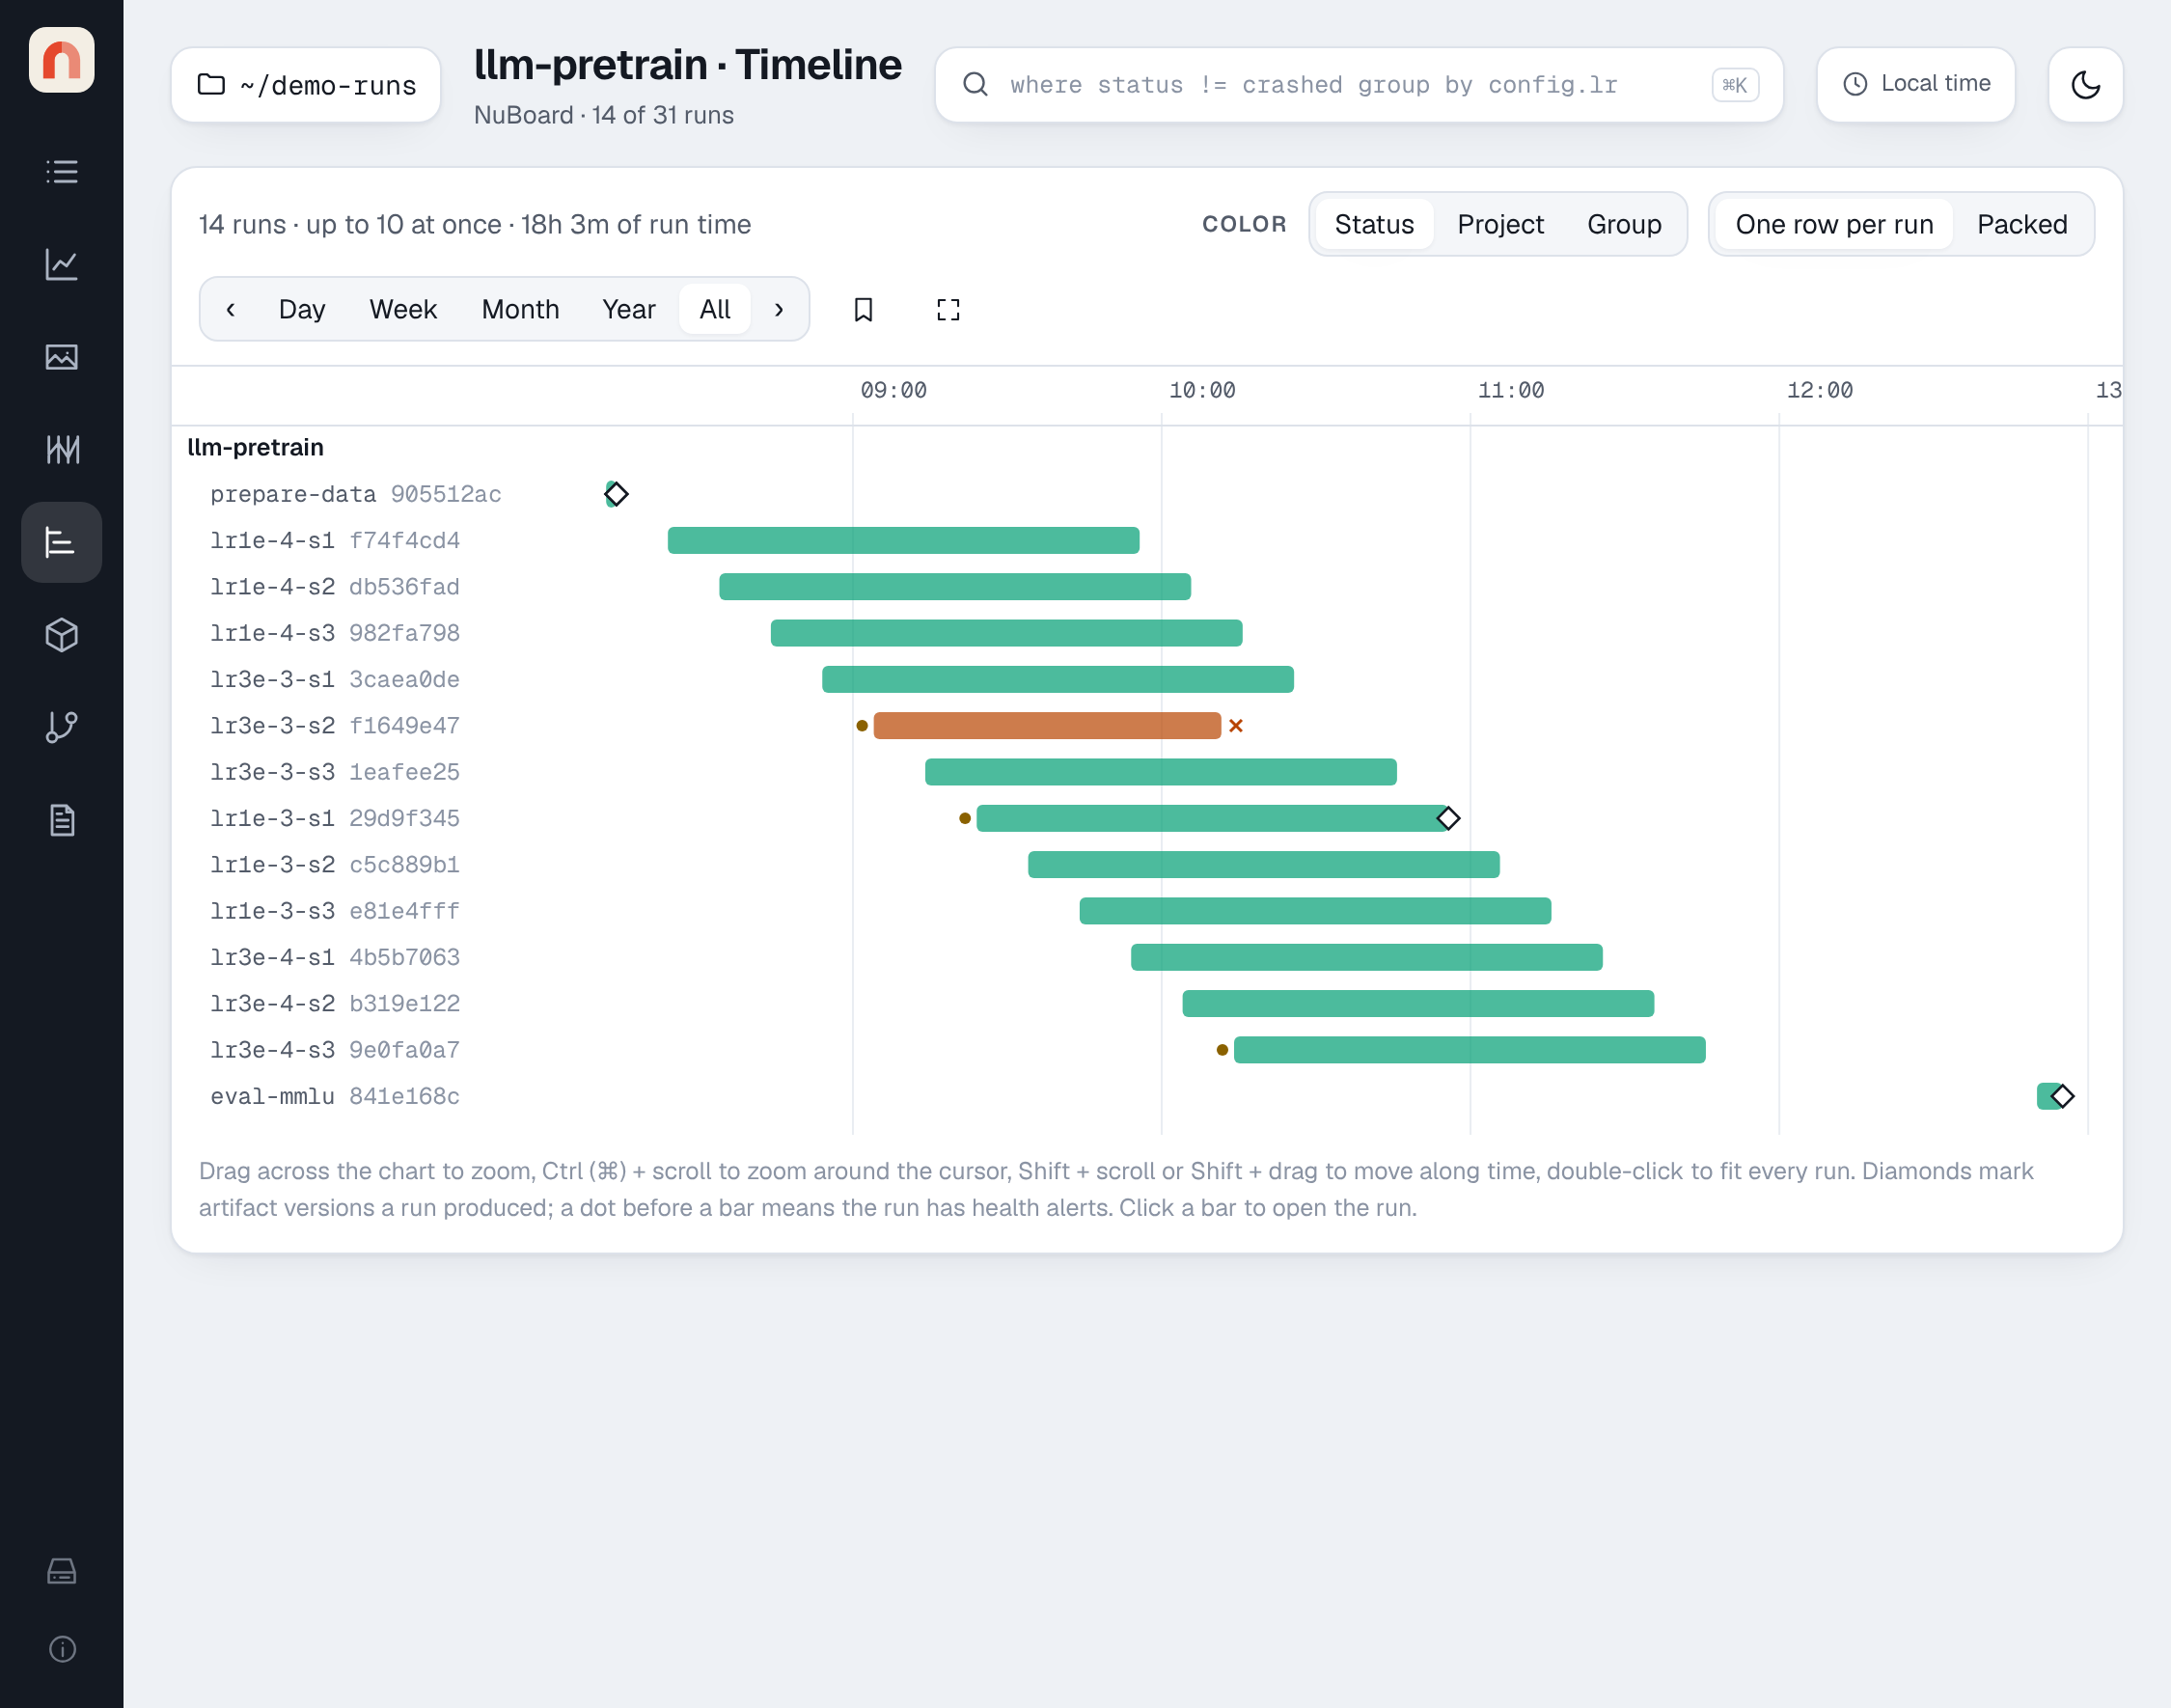
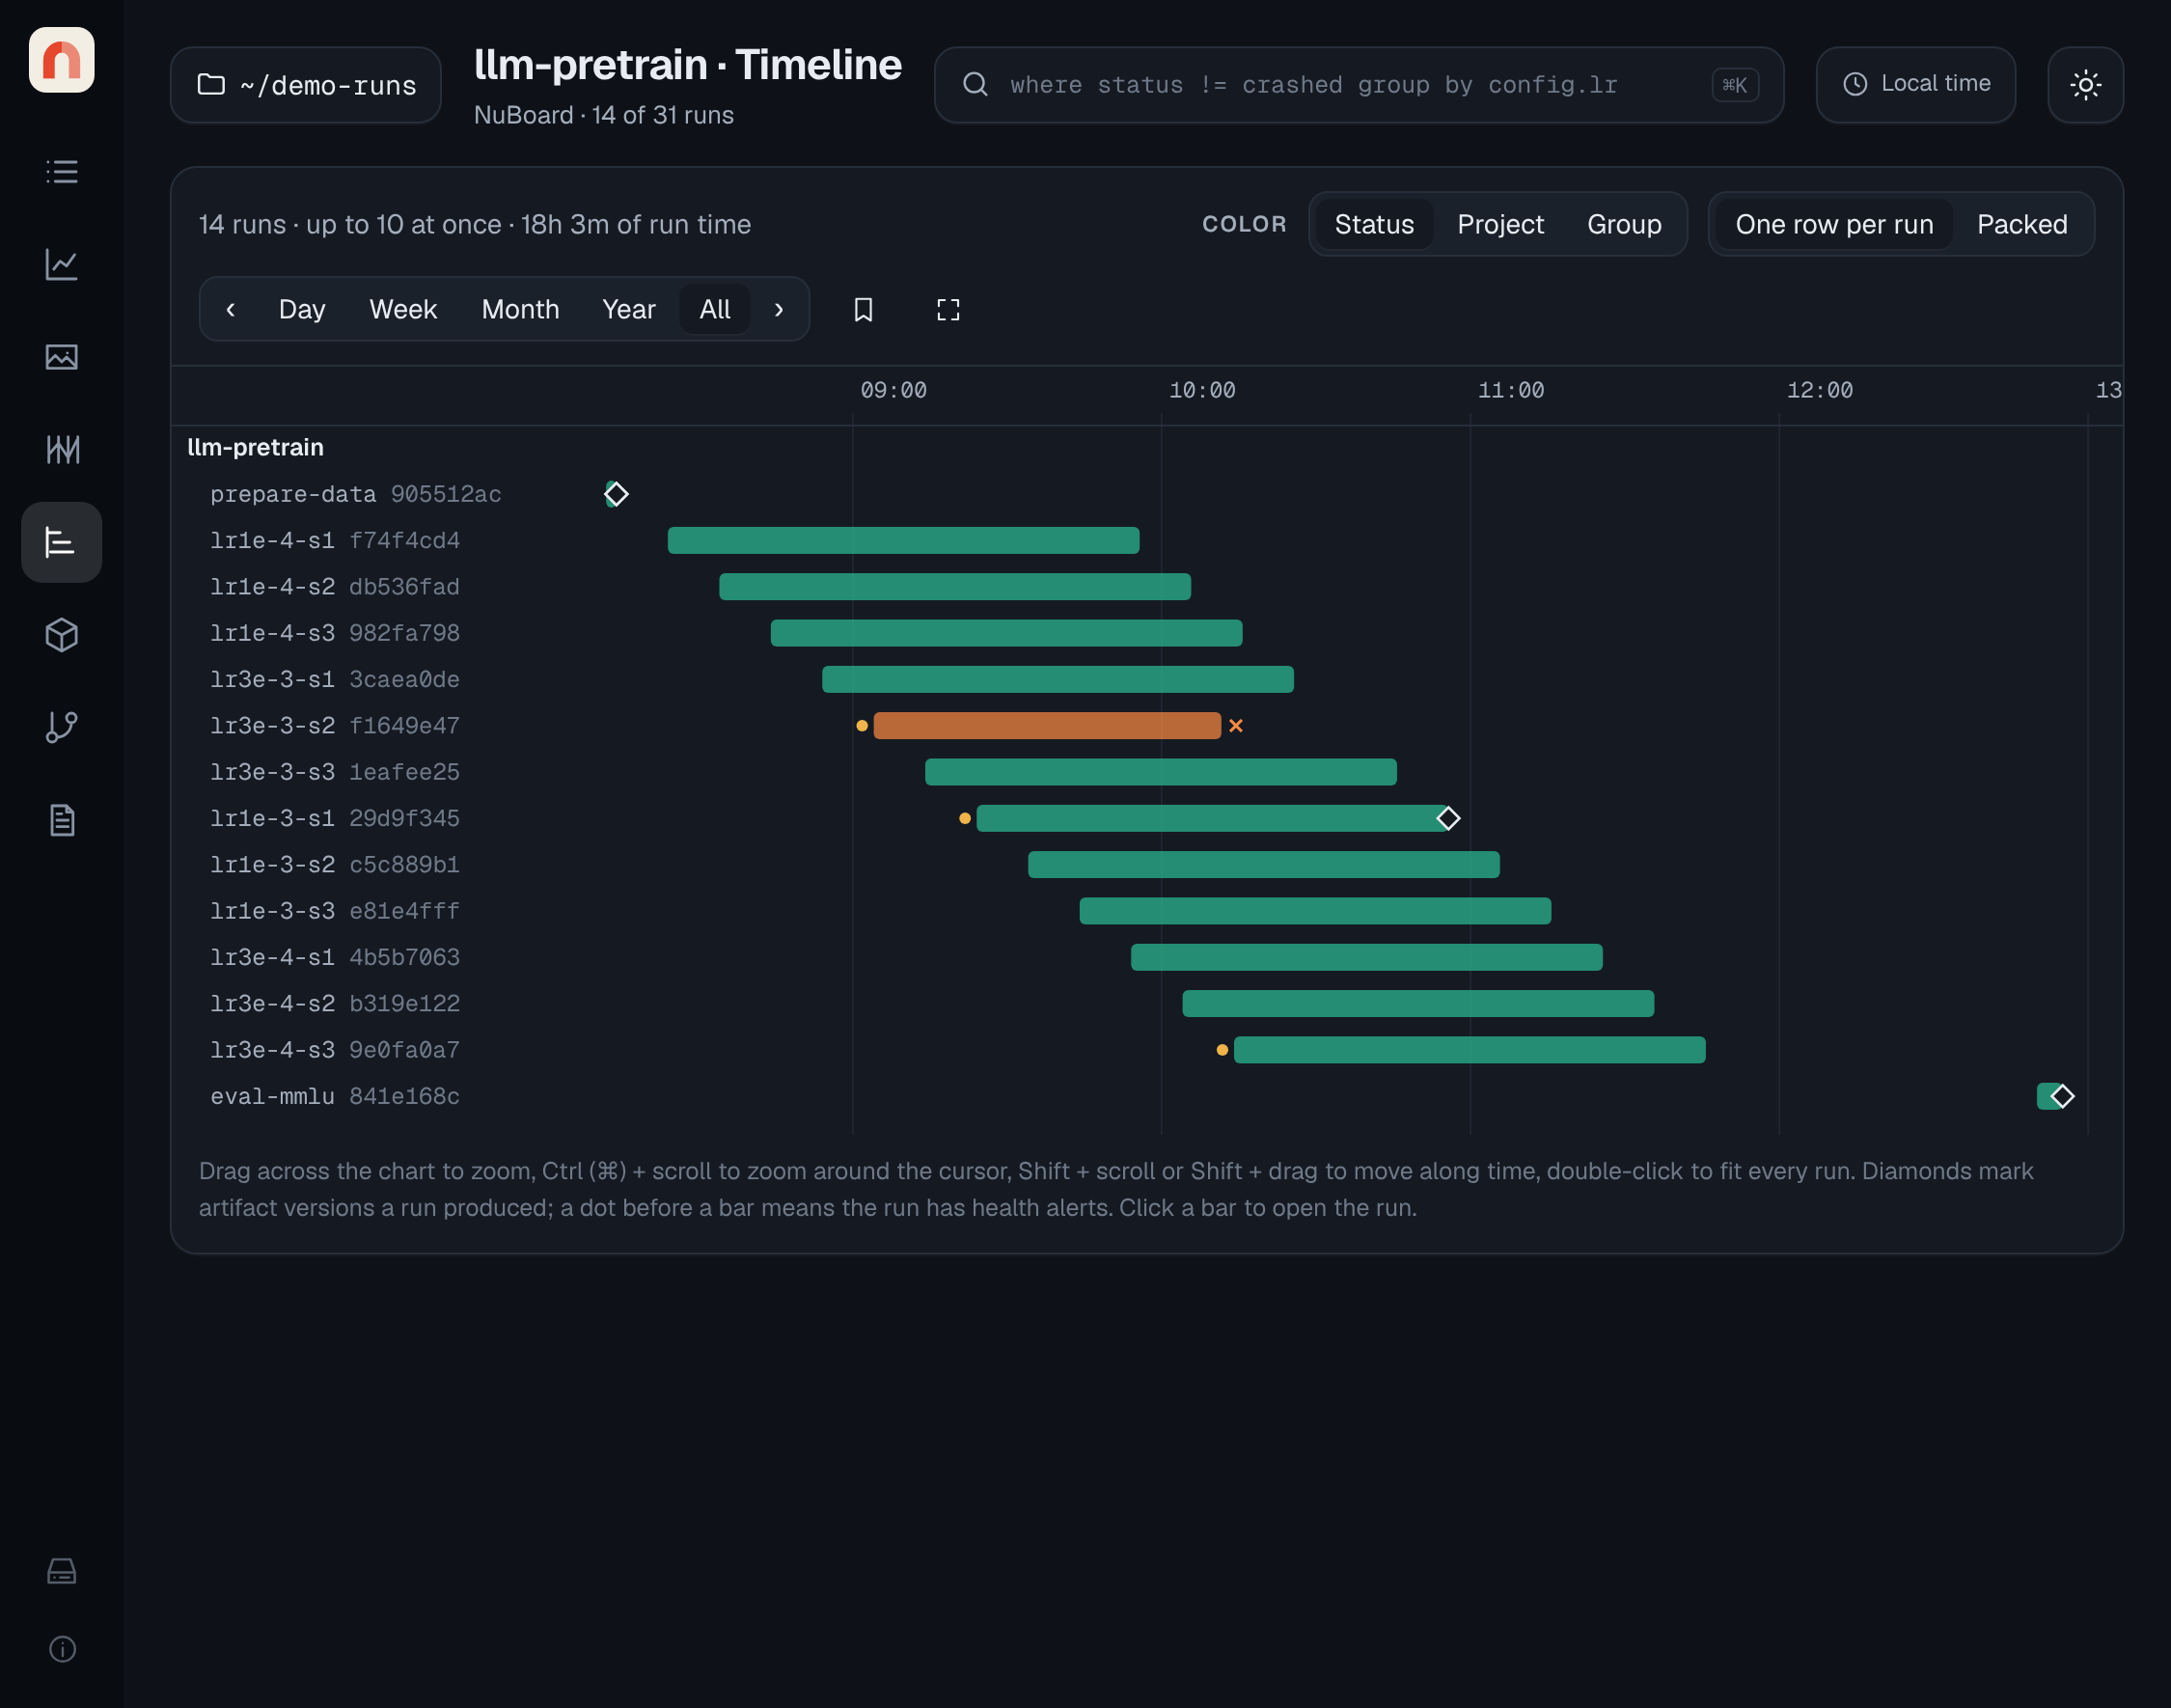
What ran before what. Overlapping runs, crashes and the artifact versions each run produced, on one time axis.
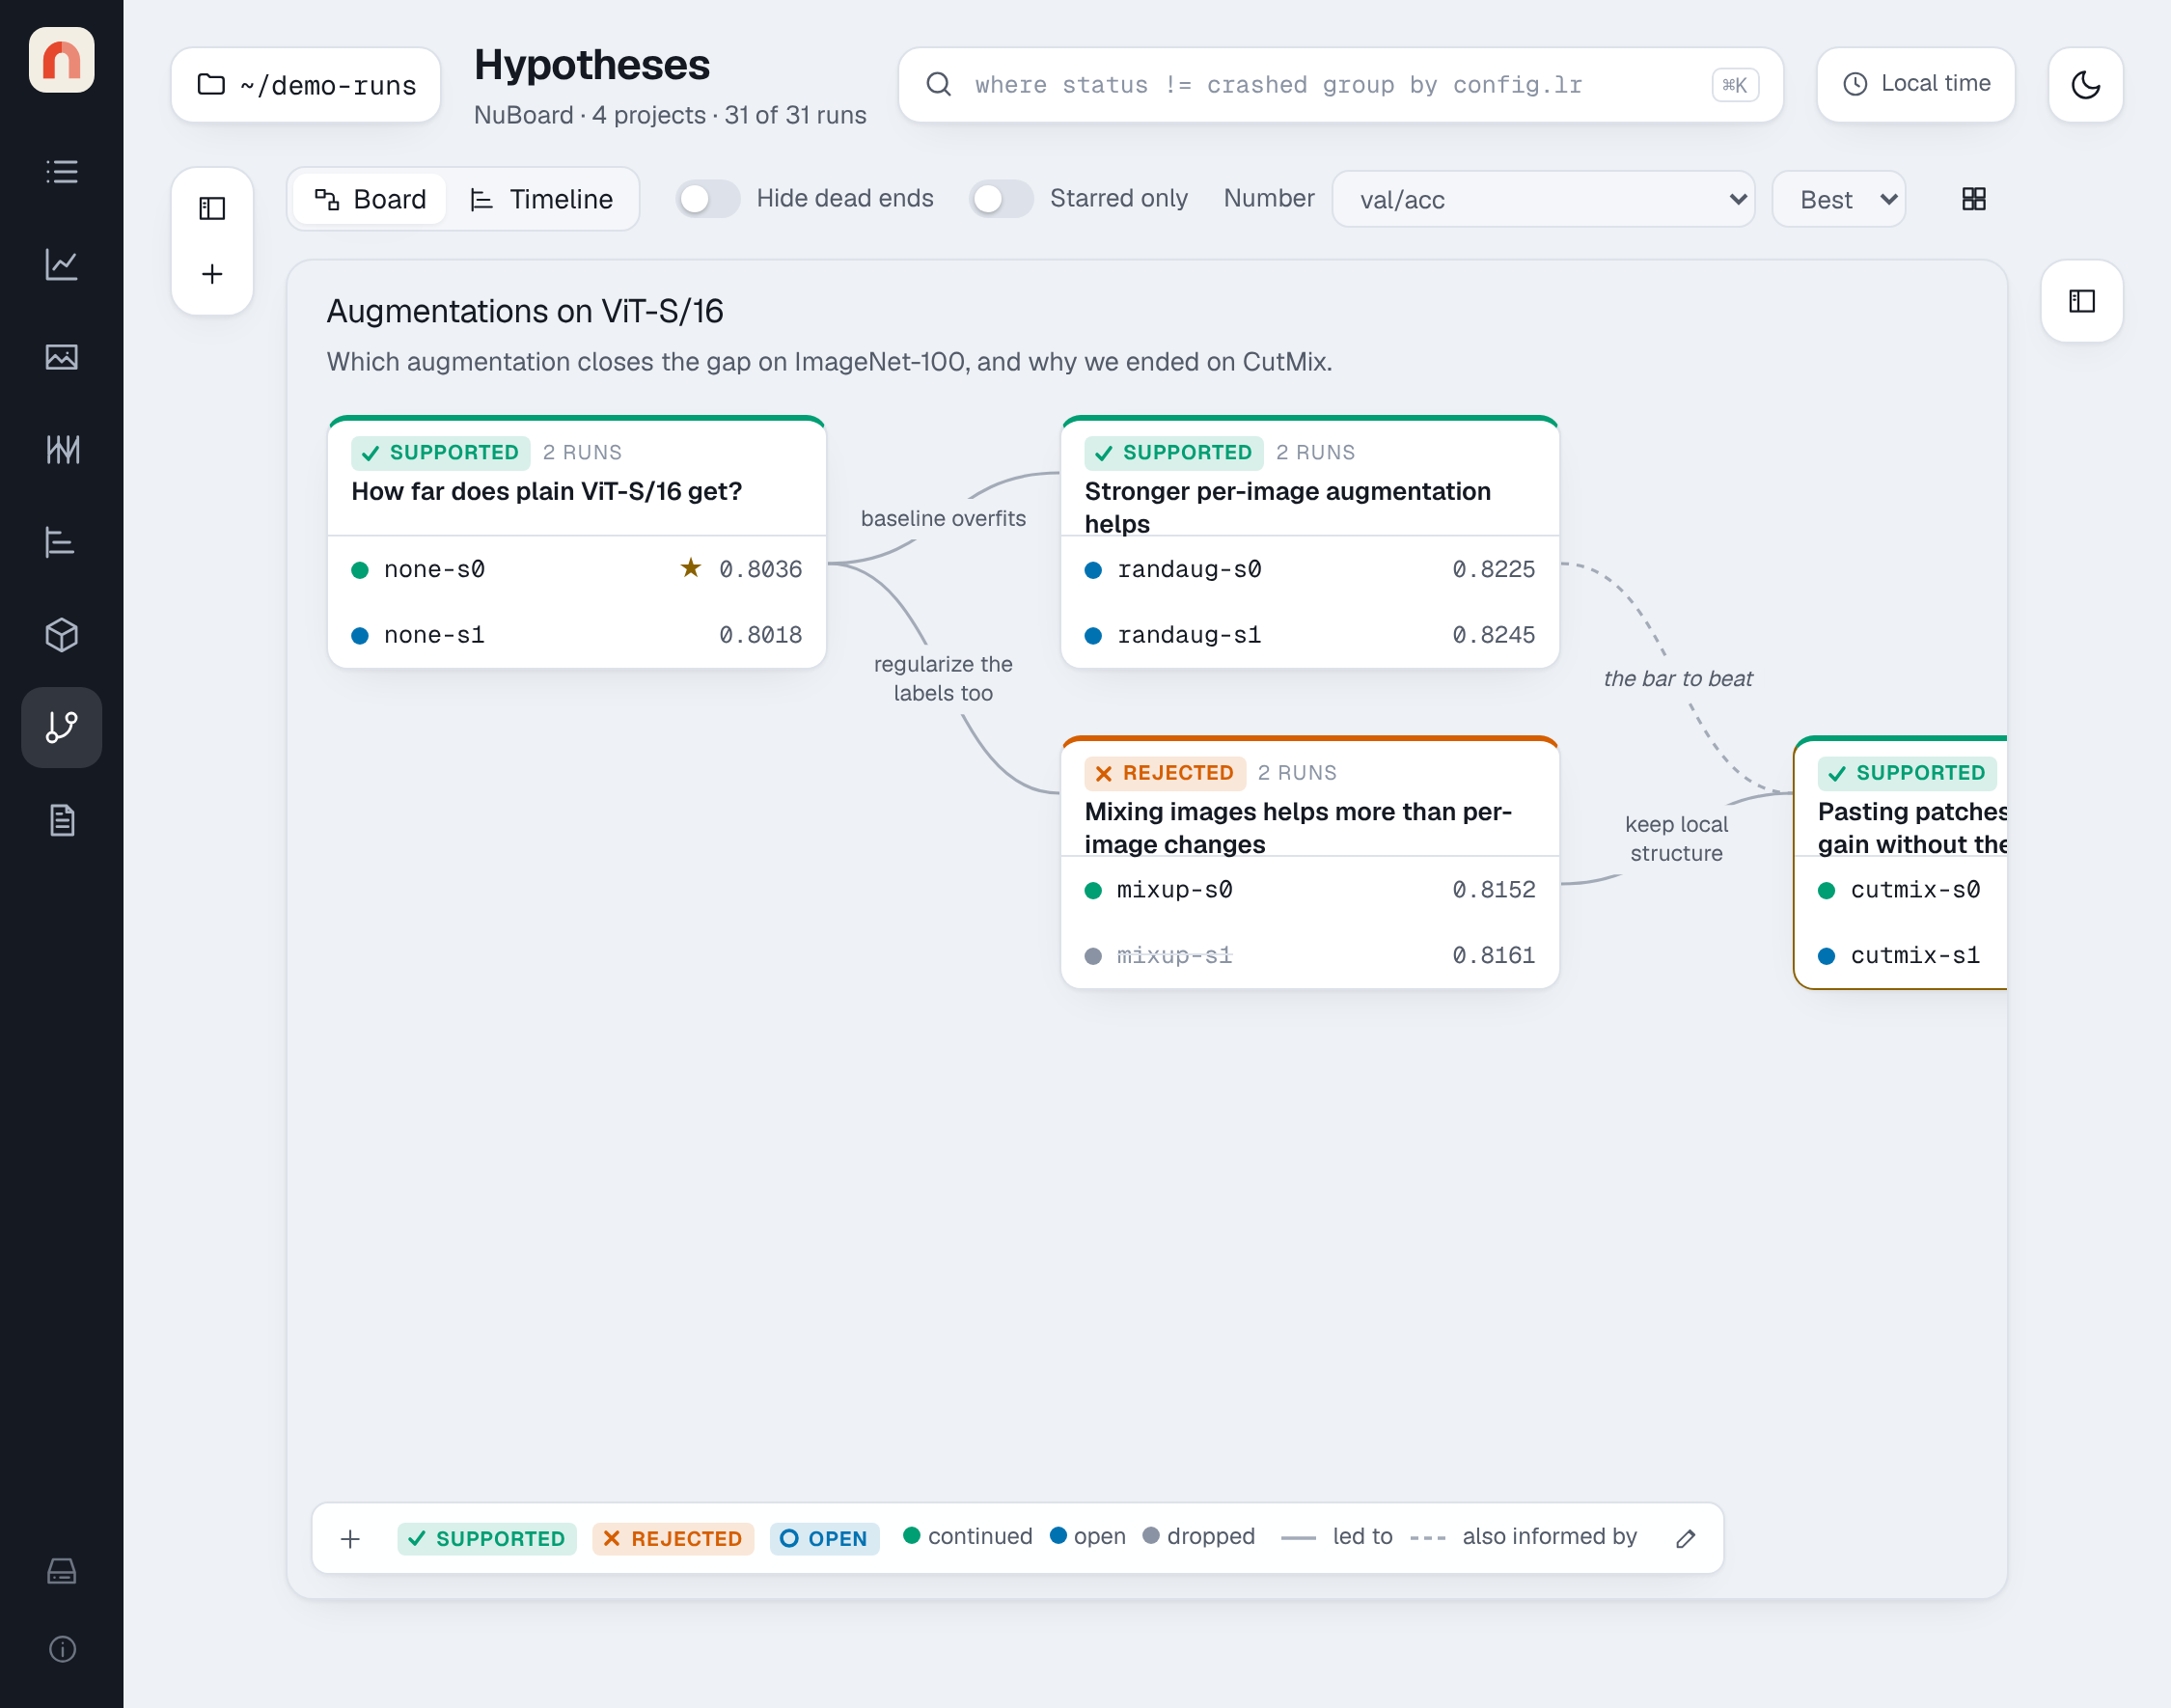
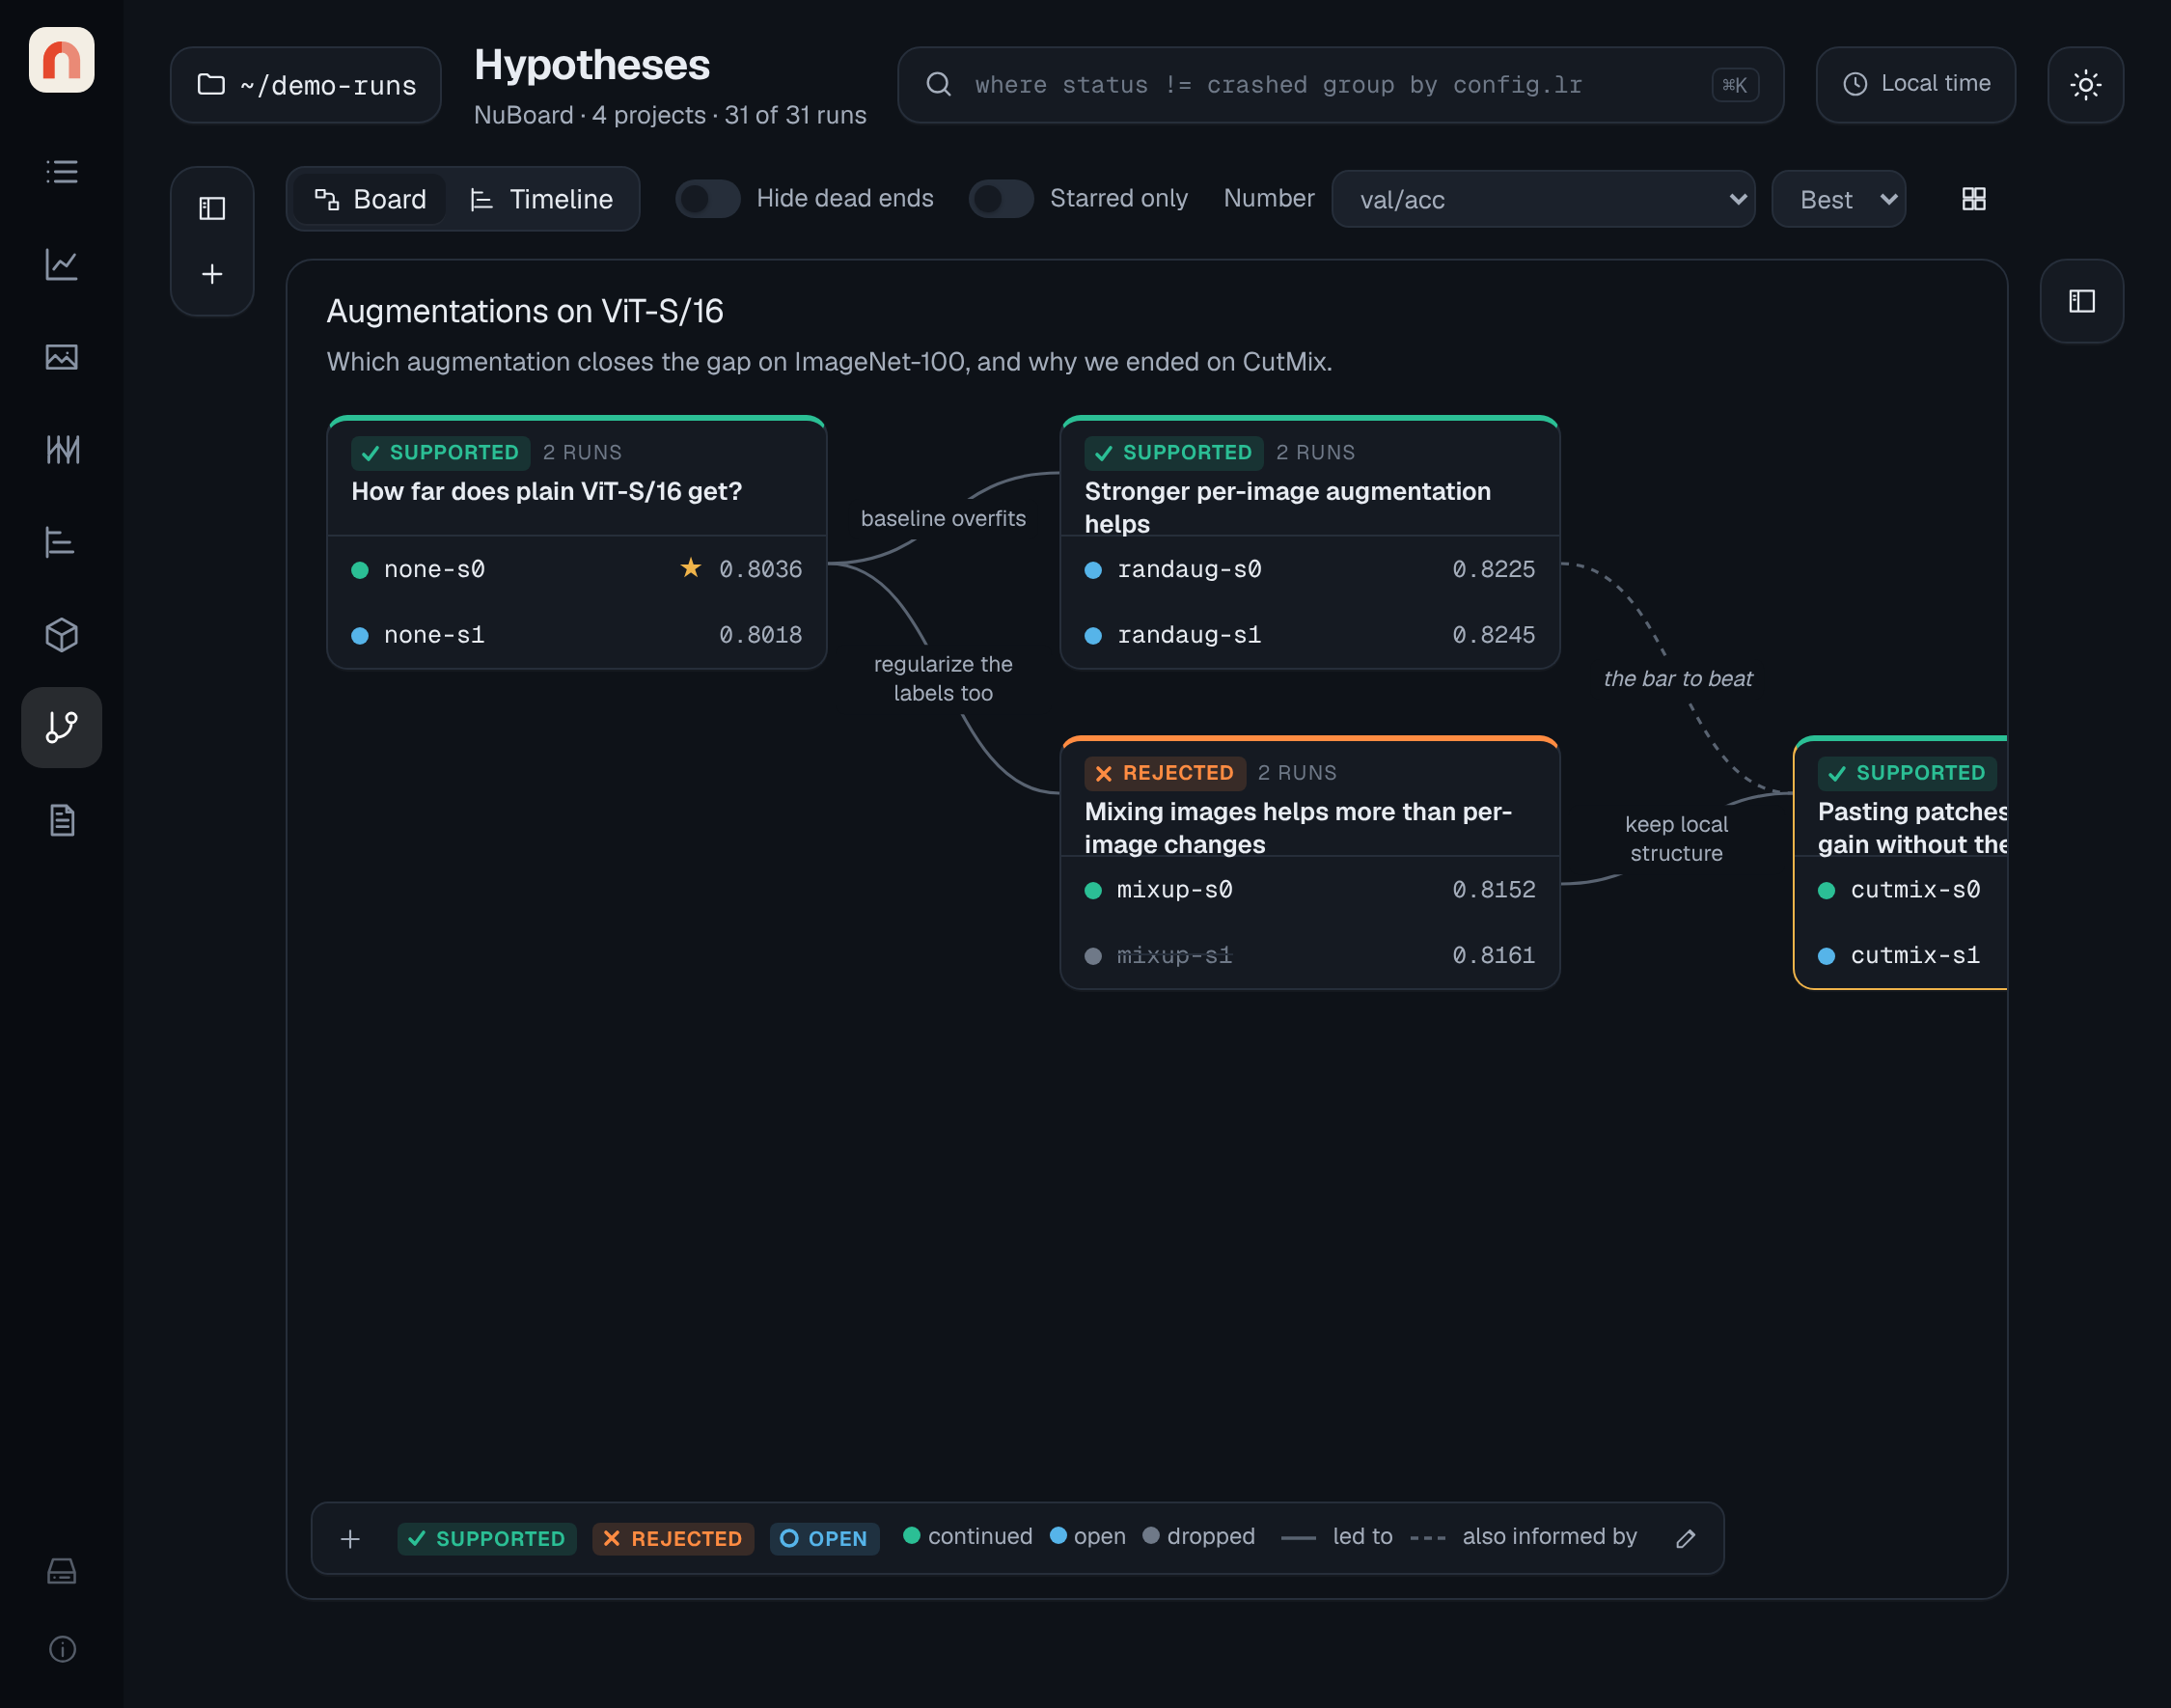
Keep the why next to the what. Each card is a question, the runs that tested it and a verdict, linked to the idea that came next.
-
Three calls to log
init,add_scalar,finish. Config, git commit and diff, installed packages, GPUs, command line and rank are recorded for you. The logging side uses only the Python standard library. -
One folder per run
A run is a folder you can copy, rsync, zip or delete. Stars, notes, tags and properties live next to the data in
annotations.json, so they move with it. -
Grouped charts
One line per learning rate with mean ± std bands over seeds, smoothing, zoom that loads finer data, a linked crosshair and live updates while runs train.
-
Sweeps
Parallel coordinates with brushing, objective-vs-parameter scatters and a rank correlation per parameter show which settings matter.
-
Health alerts
NaN and Inf values, loss and gradient spikes and throughput drops are found per run and rank and shown in the runs table and under charts.
-
Artifacts and lineage
Versioned datasets and checkpoints with a lineage graph: which run produced a version, and which runs used it.
About NuBoard
NuBoard is a local alternative to TensorBoard and hosted experiment trackers for people who train models on their own machines or clusters. Each run writes an append-only binary log from a background thread, so a crash loses at most the last second of data. When a run finishes, the log is compacted into a Parquet file with precomputed zoom levels, and the run's health alerts are recorded next to it.
nuboard up points the viewer at any folder: a single run, a project, or a
tree of many projects. It finds every run, keeps a small SQLite cache of their
metadata outside the folder, and filters them with a short query language such
as where tags has "sweep" and train/loss.min < 2.4 group by config.optim.lr.
Every view is a URL, and views and collections can be saved into the project
folder and committed to git.
License
NuBoard is free software under the MIT License.
Guides
- Installation covers
pip install nuboardand building from source. - Quickstart runs the demo and logs a first run.
- Logging from Python, Using the viewer, Sweeps, Health alerts and Artifacts explain each part in depth, and Importing from TensorBoard brings old logs in.
- The Reference documents the query language, the file format and the architecture.