add_pr_curve
run.add_pr_curve(key, labels, predictions, step=None, *, num_thresholds=201, weights=None, time=None)
Logs a precision-recall curve for a binary decision, as TensorBoard's
add_pr_curve does. For several classes, log one curve per class, one
against the rest.
Parameters
- key (str): the name the curve is logged under, such as
eval/pr/cat. - labels: the ground truth, as booleans or 0 and 1, in an array, tensor or list of any shape.
- predictions: one score in 0 to 1 per label, such as a softmax probability. Scores outside are clipped.
- step (int, optional): the training step.
- num_thresholds (int): how many evenly spaced thresholds, from 0 to 1 inclusive, to count at.
- weights (optional): a weight per example. Defaults to 1.
Stored as the true positive, false positive, true negative and false
negative counts at each threshold, with the precision and recall they give.
A prediction counts as positive at threshold t when it is at least t. The
predictions themselves are not stored, so a curve over a million examples
takes the same few kilobytes as one over a hundred.
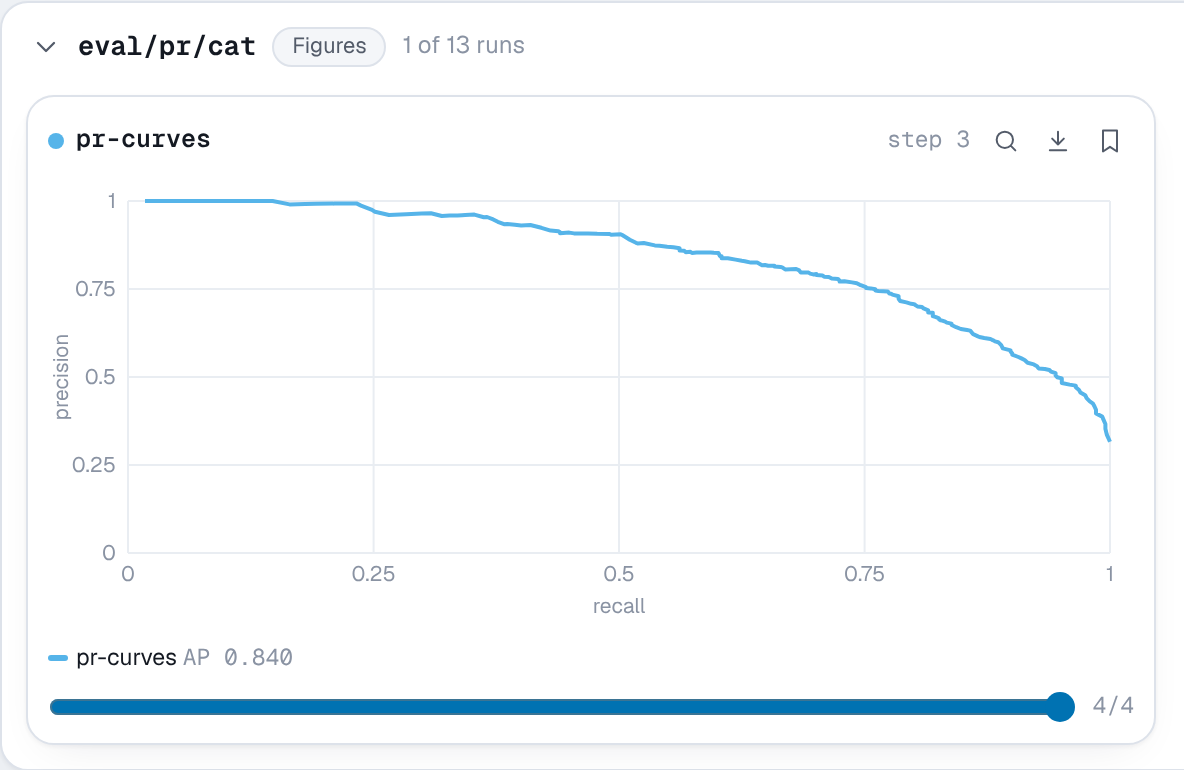
In the viewer PR curves are listed under Figures. Each card draws its
run's curve in the run's color with its average precision (AP, the area
under the curve by the trapezoidal rule, so it can differ slightly from
scikit-learn's step-wise average_precision_score), and a chart above
the cards overlays every run's curve at the chosen step. Hovering a curve
shows the threshold, precision, recall and the four counts there.
Example
import numpy as np

import nuboard as nb

classes = ["cat", "dog", "bird"]
run = nb.init("api-tour", run_name="pr-curves")
rng = np.random.default_rng(0)
labels = rng.integers(0, 3, 2000)

for epoch in range(4):
    logits = 1.5 * rng.normal(size=(2000, 3)) + (0.5 + 0.6 * epoch) * np.eye(3)[labels]
    probs = np.exp(logits) / np.exp(logits).sum(1, keepdims=True)

    for c, name in enumerate(classes):
        run.add_pr_curve(f"eval/pr/{name}", labels == c, probs[:, c], step=epoch)

run.finish()
Expected result