Health alerts
NuBoard checks every run for the problems that waste the most GPU hours, so you find them without opening every chart.
| Alert | Checked on | Fires when |
|---|---|---|
| Non-finite | every scalar | a value is NaN or ±Inf. The alert gives the first step and how many values were non-finite. |
| Spike | scalars whose name contains loss or grad |
a value jumps more than 10 robust deviations (and at least 15%) above the median of the preceding window. |
| Drop | throughput scalars: names with per_sec, per_s, throughput, fps, tokens_per, samples_per, steps_per |
the value stays below 70% of the run's median for a sustained stretch (not counting the ramp-up at the start). |
Each alert records the scalar, the rank, the step where it starts (and ends,
for spikes and drops), the value, the baseline it was compared with and a
readable message such as
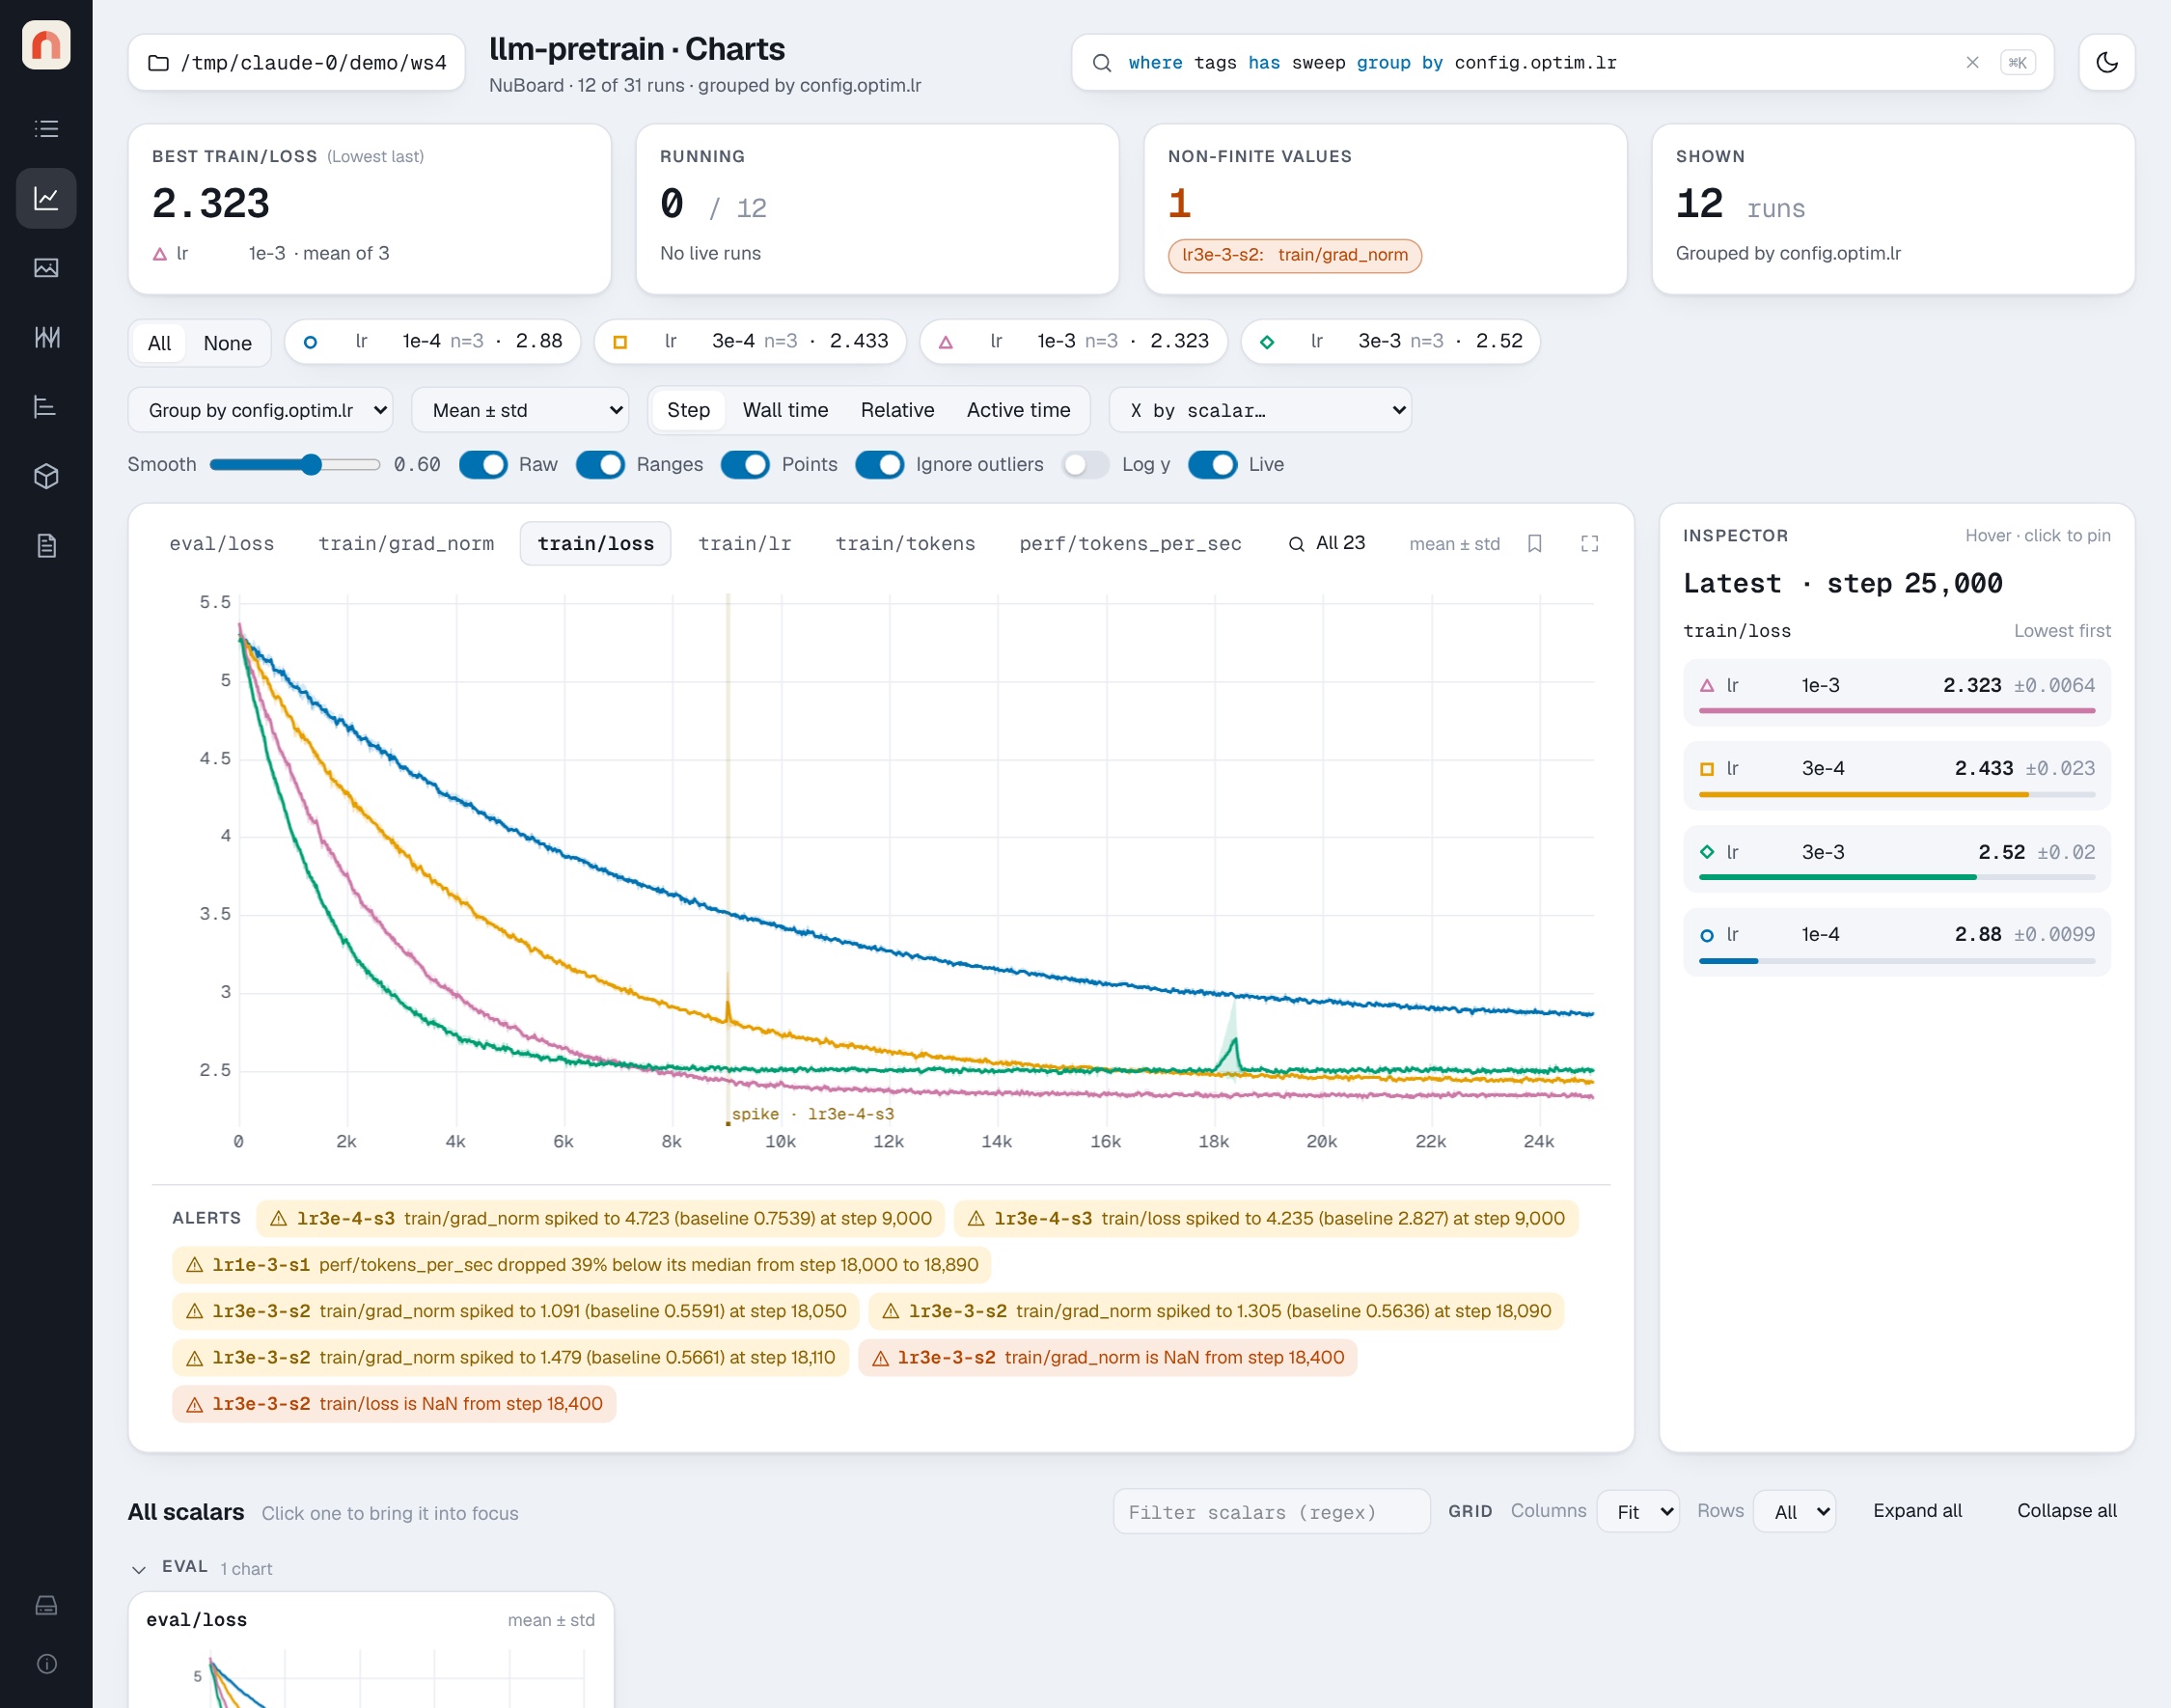
perf/tokens_per_sec dropped 39% below its median from step 18,000 to 18,890.
Where they show up
- Runs table: a warning badge next to the run name with the number of alerts; hover it to read them, click it to open the run's chart. NaN alerts make the badge red.
- Charts: a strip under the focused chart lists the alerts of the runs in view that are switched on in the legend (with grouping, the runs of the visible groups), for every scalar, not only the focused one. Alerts of runs switched off are counted in a "+N in hidden runs" note; click it to switch those runs back on. Clicking an alert focuses its scalar and zooms to the step. Spikes and drops are shaded on the step axis; NaNs keep their dashed marker.
- Timeline: a dot before a run's bar.
- Query language:
alerts > 0finds every run with an alert.
How they are computed
Checks run on at most 2,000 bucketed points per scalar (mean, minimum and maximum per bucket), so a run with millions of points is scanned in tens of milliseconds and a single-step spike still shows through the bucket maximum.
- For a finished, crashed or killed run, the checks run once when the run
is compacted, and the result is stored in
run.json→alerts. The catalog reads it from there, so the runs table never touches the data. - For a running run, the viewer computes alerts on request from the event log and caches them until the log grows.
- Runs logged before 0.2 have no stored alerts; run
nuboard compact DIR --forceto add them.
From Python:
import nuboard as nb

for run in nb.load("llm-pretrain").runs("alerts > 0"):
    for alert in run.alerts():
        print(run.name, alert["kind"], alert["message"])
The thresholds are constants at the top of nuboard/alerts.py.