Sweeps
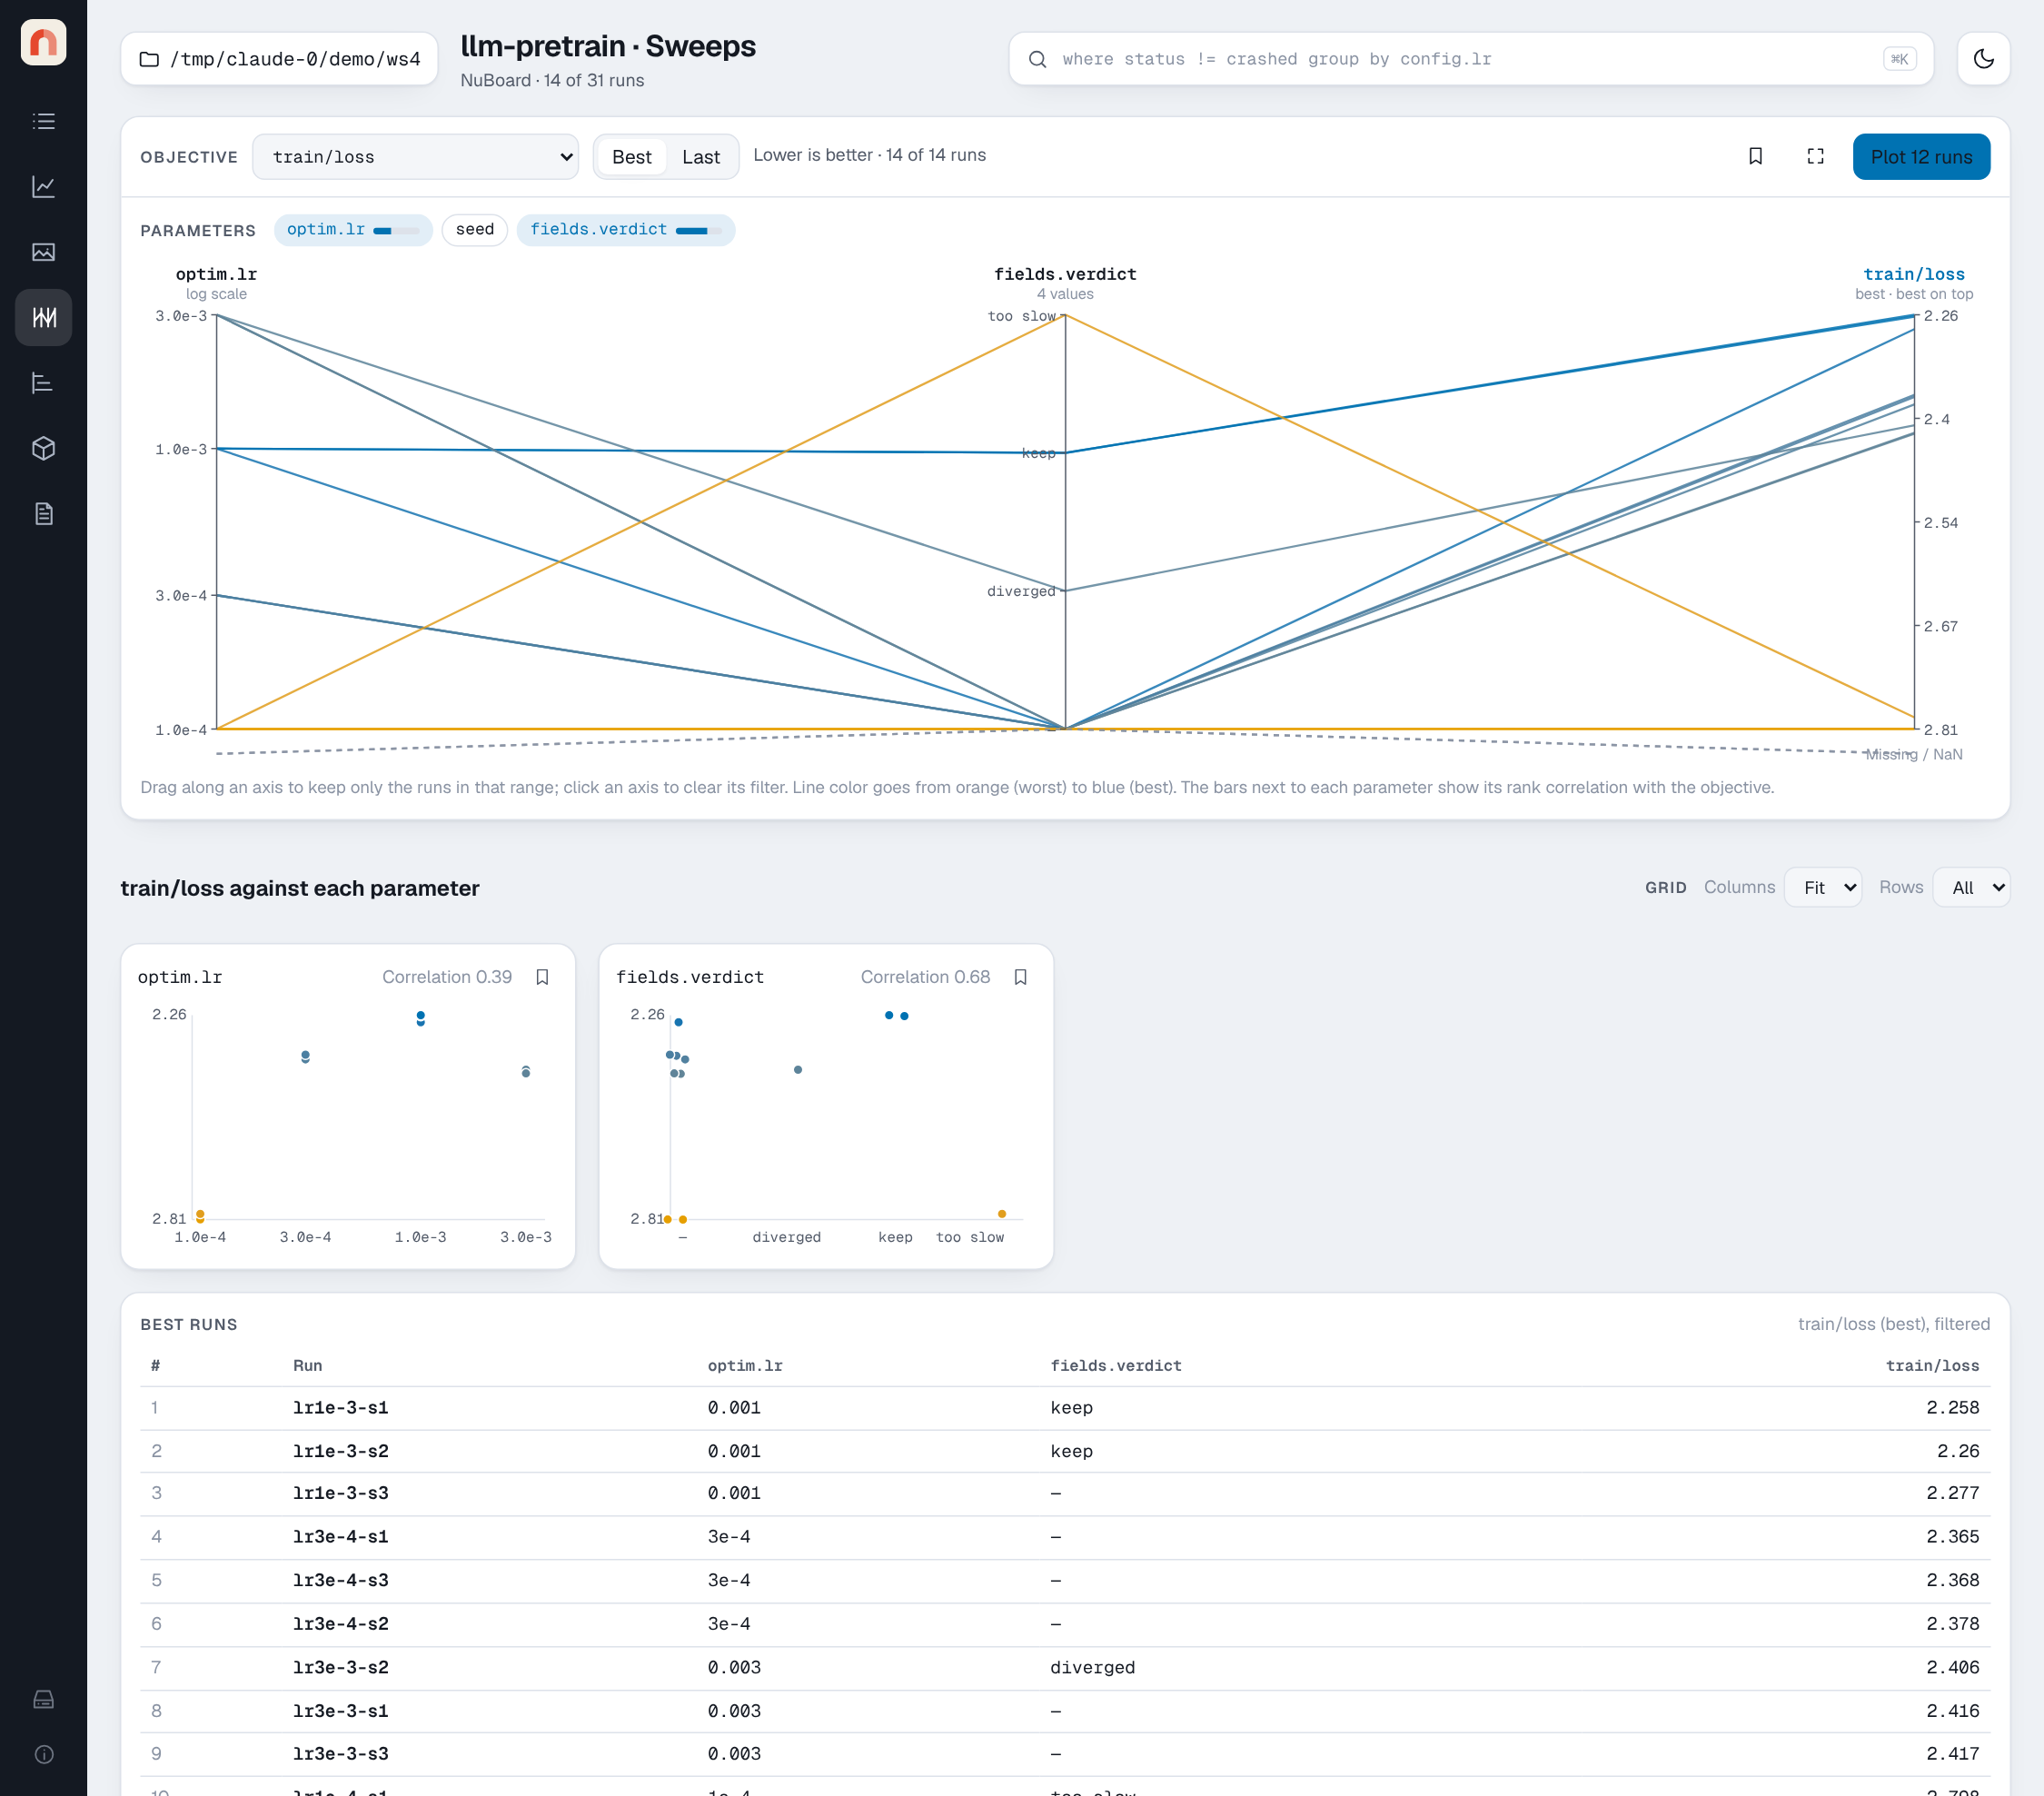
The Sweeps page answers "which settings matter, and which run is best?" for any set of runs: a project, a query result or your selection.
Logging a sweep
A sweep is nothing special to NuBoard: it is a set of runs, one per trial,
whose config holds the settings being tried. Any search tool works, from a
plain loop over a grid to a library that picks the next settings. Give the
runs a shared group or tag so a query can select them.
For example, with Optuna:
import optuna
import nuboard as nb

def objective(trial):
    cfg = {
        "lr": trial.suggest_float("lr", 1e-5, 1e-2, log=True),
        "batch": trial.suggest_categorical("batch", [32, 64, 128]),
    }
    run = nb.init("mnist", run_name=f"trial-{trial.number}", config=cfg,
                  group="lr-batch-search", tags=["sweep"])

    for epoch in range(20):
        val_loss = train_one_epoch_and_eval(cfg)  # your training code
        run.add_scalar({"val/loss": val_loss}, step=epoch)
        trial.report(val_loss, epoch)

        if trial.should_prune():
            run.finish(status="pruned")
            raise optuna.TrialPruned()

    run.finish()
    return val_loss

optuna.create_study(direction="minimize").optimize(objective, n_trials=50)
Then open Sweeps on where tags has "sweep" with val/loss as the
objective. Some notes:
- To stop a trial early, call
run.finish(status="pruned")(any status name works) before raising. A run that is already finished keeps its status, even insidewith nb.init(...); without that call, an exception ending the run records it ascrashed. - Trials can run in parallel, in several processes or on several machines: each run writes its own folder, so nothing needs to be shared on the NuBoard side.
Objective and parameters
- Objective: pick a scalar and whether to use its Best value (the minimum for losses and errors, the maximum otherwise) or its Last value. Lower-is-better scalars are flipped so the best runs are always on top.
- Parameters: every config key whose value differs between the runs, plus properties. The chosen ones are chips in axis order: drag a chip to move its axis, and click its × to remove it. The bar inside a chip is the parameter's rank correlation with the objective: Spearman's ρ for numbers, the correlation ratio on ranks for categories. It is a quick hint, not a causal estimate.
Picking parameters
Parameters opens a searchable list of every differing key, grouped by
prefix (optim.lr and optim.wd under optim). The search takes the same
syntax as the run settings filter: plain text, /regex/ and !exclude. Each
row shows whether the key is a number or a category, how many distinct values
it has, and its correlation bar. Rows are marked many values (more than 12
distinct categories), id-like (a different value in every run) or long
text. Clear all removes every axis, and Reset to defaults goes back
to the automatic choice.
When nothing is picked, Sweeps shows up to six keys, the most correlated with the objective first. It leaves out seeds, paths, folders and files, id-like keys, long text and keys with many values. Your last choice is remembered for each project in this browser.
A category with more than 12 values keeps its 11 most common on the axis and gathers the rest in (other).
Hiding keys for a project
When every run shown is from one project, Hide matching keys at the bottom
of the list takes a filter such as !seed !.path !logging.. Keys the filter
excludes leave the list and the defaults for everyone who opens the project.
Show N hidden lists them again, faded, so you can still pick one. The rules
are saved in the project's sweeps.json.
Numeric parameters that span more than a factor of 20 use a log axis. Text and boolean parameters become ordered categories.
Datasets and other artifacts
The artifact versions a run used (run.use_artifact("datasets/fineweb-edu:v2"))
are parameters too, named inputs.<artifact> with the version as the value
(v2; v1+v2 for a run that used two). Runs that used none show —. So runs
can be compared by data version without copying it into the config: in the
demo, open Sweeps on llm-pretrain and pick inputs.fineweb-edu.
Lists and dicts
A list, or a dict inside a list, is one category per distinct value. Its axis
label shows only what differs from the other values: the elements that differ
for lists of one length ([0]=0.08), the items not in every list for lists of
different lengths (flip, mixup), and the paths that differ for nested values
([1].dim=512). Labels are cut to 40 characters. Hover a label for the full
value, or click it to open it pretty-printed with a Copy button. The Best
runs table uses the same labels.
A list of plain values with the same length in every run has a Split button
in the picker. It replaces the list with one parameter per element that
differs (crop_scale[0]), each a numeric axis when its values are numbers.
Join puts the list back. Splits are kept in the URL (split=crop_scale), so
saved views and report links keep them. In the demo, try crop_scale and
transforms on vit-ablations.
Parallel coordinates
Each run is one line through every parameter axis to the objective axis. Lines are colored from orange (worst) to blue (best). Runs without a value for the objective (still starting, or diverged to NaN) are dashed and end below the axis.
Drag along any axis to keep only the runs inside that range. Filters on several axes combine, and the scatters, best-runs table and Plot N runs button follow them. Click an axis to clear its filter.
The corner button next to Plot N runs shows the chart full screen (Esc leaves), and the bookmark button adds it to a report as a snapshot.
Scatters and best runs
Below the chart, one scatter per parameter plots the objective against it.
Grid sets the plots per row (fit to width, or 1 to 6) and the rows per page
(1 to 6, or all), with a pager when there are more; both are remembered and
kept in the URL (scols, srows). The bookmark button on each scatter adds
it to a report.
The Best runs table lists the top ten runs that pass the filters. Click a
run anywhere on the page to open its details on the Runs page, or press
Plot N runs to open them on Charts.
All of the page's state (objective, statistic, parameters) is in the URL, so a sweep view can be bookmarked or saved like any other view.