add_point_cloud
run.add_point_cloud(key, points, step=None, *, colors=None, axes=False, caption=None, time=None)
Logs 3D points, such as a lidar scan, points sampled from a mesh, or an
embedding reduced to three dimensions. This covers TensorBoard's add_mesh
for point clouds and, with a reduction such as PCA, its add_embedding.
Parameters
- key (str): the name the point cloud is logged under.
- points: an
(N, 3)array, tensor or list of x, y and z positions. - step (int, optional): the training step.
- colors (optional): an
(N, 3)array, tensor or list of RGB colors, asuint8or floats in 0 to 1. Without colors, points are colored by height. - axes (bool or three str):
Trueto show the x, y and z axes from the start, or three names to label them, such as("x (m)", "y (m)", "z (m)"). The viewer can show the axes either way. - caption (str, optional): a caption shown under the view.
Stored as float32 positions, 12 bytes per point, plus 3 bytes per point for colors, packed with the standard library.
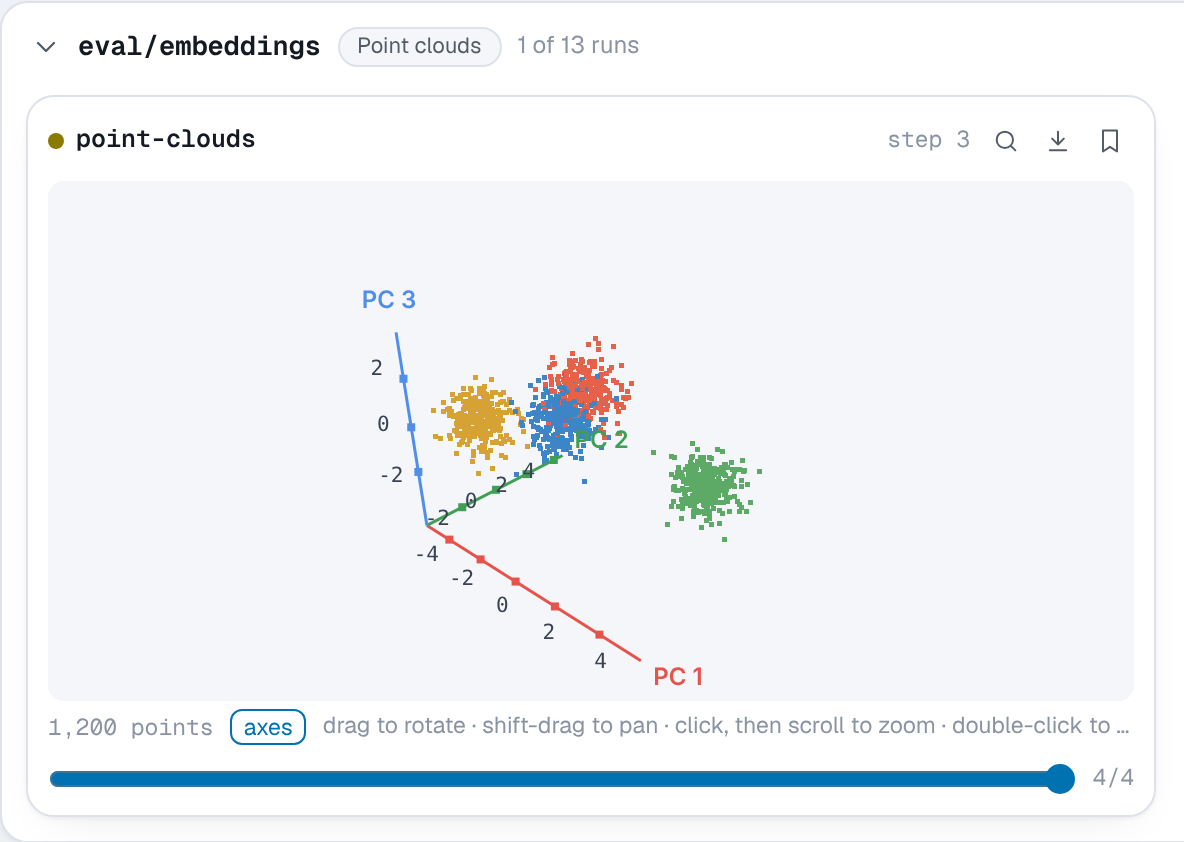
In the viewer point clouds are drawn in a view you can rotate (drag), pan (shift-drag), zoom (click, then scroll) and reset (double-click). z is up. Axes draws the three axes from the cloud's lowest corner, with round values along them. The renderer is plain canvas code, so it needs no WebGL and works the same in an HTML export. Point clouds are listed under Point clouds.
Example
import numpy as np

import nuboard as nb

run = nb.init("api-tour", run_name="point-clouds")
rng = np.random.default_rng(0)
palette = np.array([[230, 97, 74], [61, 133, 198], [92, 170, 102], [214, 162, 51]], np.uint8)
centers = rng.normal(0, 3, (4, 3))
labels = rng.integers(0, 4, 1200)

for epoch in range(4):
    spread = 2.5 / (1 + epoch)  # the classes separate as training goes on
    emb = centers[labels] + rng.normal(0, spread, (labels.size, 3))
    run.add_point_cloud(
        "eval/embeddings",
        emb,
        step=epoch,
        colors=palette[labels],
        axes=("PC 1", "PC 2", "PC 3"),
    )

u, v = np.meshgrid(np.linspace(0, 2 * np.pi, 80), np.linspace(0, 2 * np.pi, 30))
torus = np.stack([(2 + np.cos(v)) * np.cos(u), (2 + np.cos(v)) * np.sin(u), np.sin(v)], -1)
run.add_point_cloud("scene/torus", torus.reshape(-1, 3), step=0)  # colored by height
run.finish()
Expected result