add_image
run.add_image(key, image, step=None, *, caption=None, time=None)
Logs an image, such as an input batch, a reconstruction or an attention map.
Parameters
- key (str): the name the image is logged under.
- image: one of
- a NumPy array or tensor of shape
(H, W)(grayscale),(H, W, C)or(C, H, W), withCbeing 1 (gray), 3 (RGB) or 4 (RGBA); - a PIL image;
- PNG, JPEG, GIF, WebP or SVG bytes;
- the path of an image file.
- a NumPy array or tensor of shape
- step (int, optional): the training step.
- caption (str, optional): a caption shown under the image.
Shape and dtype. A 3-D array whose first axis is 1, 3 or 4 and whose last
axis is not is read as (C, H, W), the PyTorch layout. Otherwise it is read as
(H, W, C). This matches TensorBoard's dataformats="CHW" and "HWC" without
having to pass it. The values are read by dtype:
| dtype | Range | Stored |
|---|---|---|
uint8 |
0 to 255 | as is |
| floats | 0 to 1, clipped | scaled to 0 to 255 |
| other integers | 0 to 255, clipped | as is |
To log a batch as one picture, tile it first, for example with
torchvision.utils.make_grid(batch), which returns a (3, H, W) tensor.
Stored as a PNG for arrays and PIL images. The PNG is encoded with the
standard library's zlib, so neither PIL nor NumPy is needed for encoding.
Bytes and files are stored as they are, so a JPEG stays a JPEG.
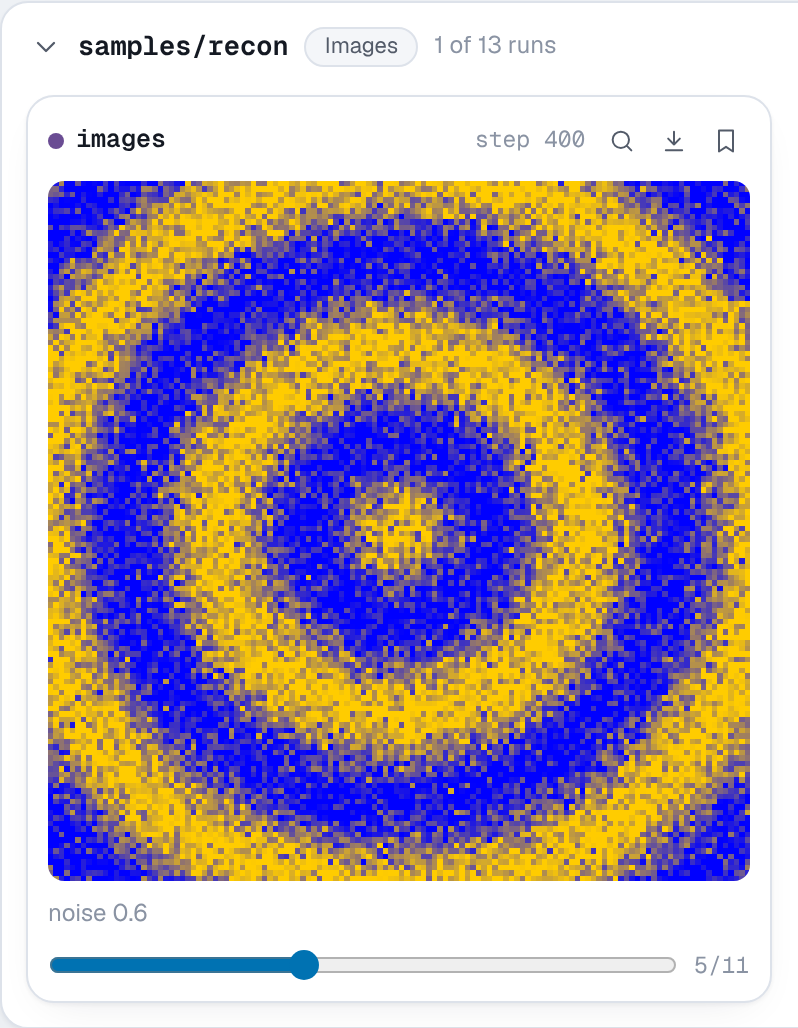
In the viewer each card shows the image at its step, with a slider over the steps it was logged at. Clicking it opens it large. Images are listed under Images.
Example
import numpy as np

import nuboard as nb

run = nb.init("api-tour", run_name="images")
y, x = np.mgrid[-1:1:128j, -1:1:128j]
target = 0.5 + 0.5 * np.cos(12 * np.hypot(x, y))  # rings, floats in [0, 1]
rng = np.random.default_rng(0)

for step in range(0, 1001, 100):
    noise = 1 - step / 1000
    recon = np.clip(target + noise * rng.normal(0, 0.4, target.shape), 0, 1)
    rgb = np.stack([recon, recon * 0.8, 1 - recon])  # (3, H, W), as PyTorch lays it out
    run.add_scalar({"train/mse": float(((recon - target) ** 2).mean())}, step=step)
    run.add_image("samples/recon", rgb, step=step, caption=f"noise {noise:.1f}")

run.add_image("samples/target", (target * 255).astype(np.uint8), step=0)  # (H, W) gray
run.finish()
Expected result