add_histogram
run.add_histogram(key, values, step=None, *, bins=50, range=None, weights=None, time=None)
Logs the distribution of some values, as TensorBoard's add_histogram does.
Use it to watch weights, gradients or activations drift, vanish or explode,
or for the spread of a per-example score.
Parameters
- key (str): the name the distribution is logged under.
- values: numbers of any shape, as an array, tensor or list. They are flattened.
- step (int, optional): the training step.
- bins (int or list of float): the number of equal-width bins, or their edges, which must increase.
- range ((float, float), optional): the low and high ends of the bins.
Values outside are counted as
outsidebut not binned. Defaults to the values' minimum and maximum. - weights (optional): a weight per value, of the same shape as
values.
Stored as the bin edges and counts, with the count, minimum, maximum,
mean and standard deviation of the values. NaN and infinite values are counted
as nonfinite and left out of the bins and statistics. A layer with millions
of weights takes a few hundred bytes per step. Arrays and tensors are binned
with NumPy on the background thread. Lists are binned in pure Python.
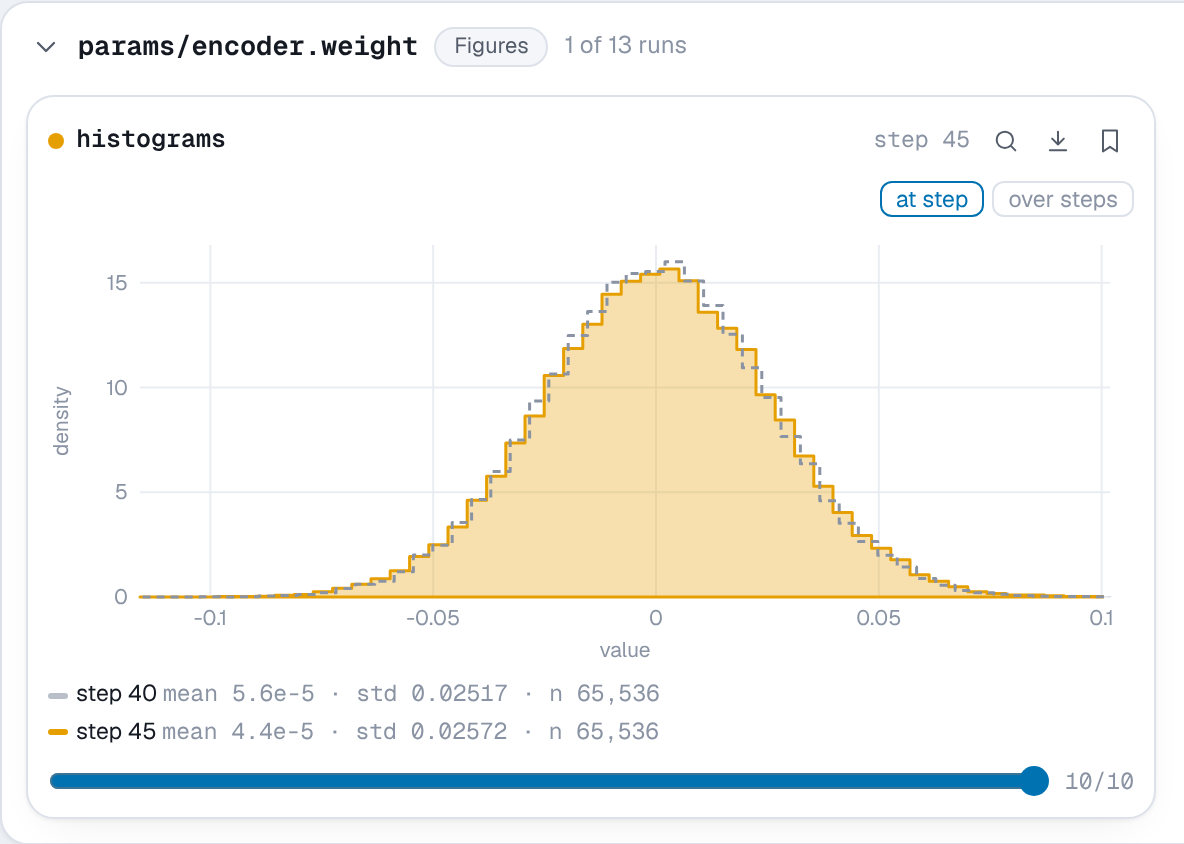
In the viewer distributions are listed under Figures. Each card draws the histogram at the chosen step, filled in the run's color, with the step logged before it as a dashed outline. The y axis is density, so steps and runs with different ranges or bin counts compare fairly. Over steps switches to TensorBoard's distributions view: the median as a line, and bands holding 68%, 86% and all of the values at each step. A chart above the cards overlays every run's histogram at the chosen step.
Example
import numpy as np

import nuboard as nb

run = nb.init("api-tour", run_name="histograms")
rng = np.random.default_rng(0)
weights = rng.normal(0, 0.02, 65_536)

for epoch in range(0, 50, 5):
    grads = rng.standard_t(6, 65_536) * 0.01 / (1 + epoch / 10)
    weights = weights * 1.01 + rng.normal(0, 0.004, weights.size)
    run.add_histogram("params/encoder.weight", weights, step=epoch)
    run.add_histogram("grads/encoder.weight", grads, step=epoch, bins=80, range=(-0.05, 0.05))

run.finish()
With PyTorch, log every parameter and its gradient after the backward pass:
for name, p in model.named_parameters():
    run.add_histogram(f"params/{name}", p, step=epoch)
    if p.grad is not None:
        run.add_histogram(f"grads/{name}", p.grad, step=epoch)
Expected result