add_scalar
run.add_scalar(key, value=None, step=None, *, low=None, high=None, time=None)
Logs a scalar, such as a loss, an accuracy or a learning rate, or several
scalars at the same step. It covers TensorBoard's add_scalar and
add_scalars in one method:
run.add_scalar("train/loss", 0.42, step=10)  # one
run.add_scalar({"train/loss": 0.42, "train/lr": 3e-4}, step=10)  # several
Parameters
- key (str or dict): the scalar's name, such as
"train/loss". To log several at once, a dict of names and values. Nested dicts are flattened with/, so{"train": {"loss": 0.4}}logstrain/loss. - value: the value, when
keyis a name. It can be a Python number or bool, a NumPy scalar or a 0-d tensor. Values are converted to float on the background thread, so passing a CUDA tensor does not sync on the calling thread. Strings are skipped with a one-time warning; useadd_textfor those. - step (int, optional): the training step. Defaults to one more than the previous call's step. Pass it explicitly when you log several times per step, such as train and eval scalars.
- low, high (optional): a range around the value, given together,
such as
mean - stdandmean + std, a confidence interval or the min and max over an epoch's batches. Any number typevalueaccepts works. Only with a single name, not a dict. Leave both out for a plain scalar. - time (float, optional): a Unix timestamp. Defaults to now.
Raises TypeError when key is a name and value is missing, when only
one of low and high is given, or when they are given with a dict.
# Per-epoch mean with a ± std band
run.add_scalar("val/loss", mean, step=epoch, low=mean - std, high=mean + std)
Stored as one columnar frame per flush in the event log: a step, a time
and a float64 per scalar. Logging a dict of 50 scalars costs a few
microseconds, and each value takes about 8 bytes on disk. low and high
are stored as two more values at the same step (see the
file format).
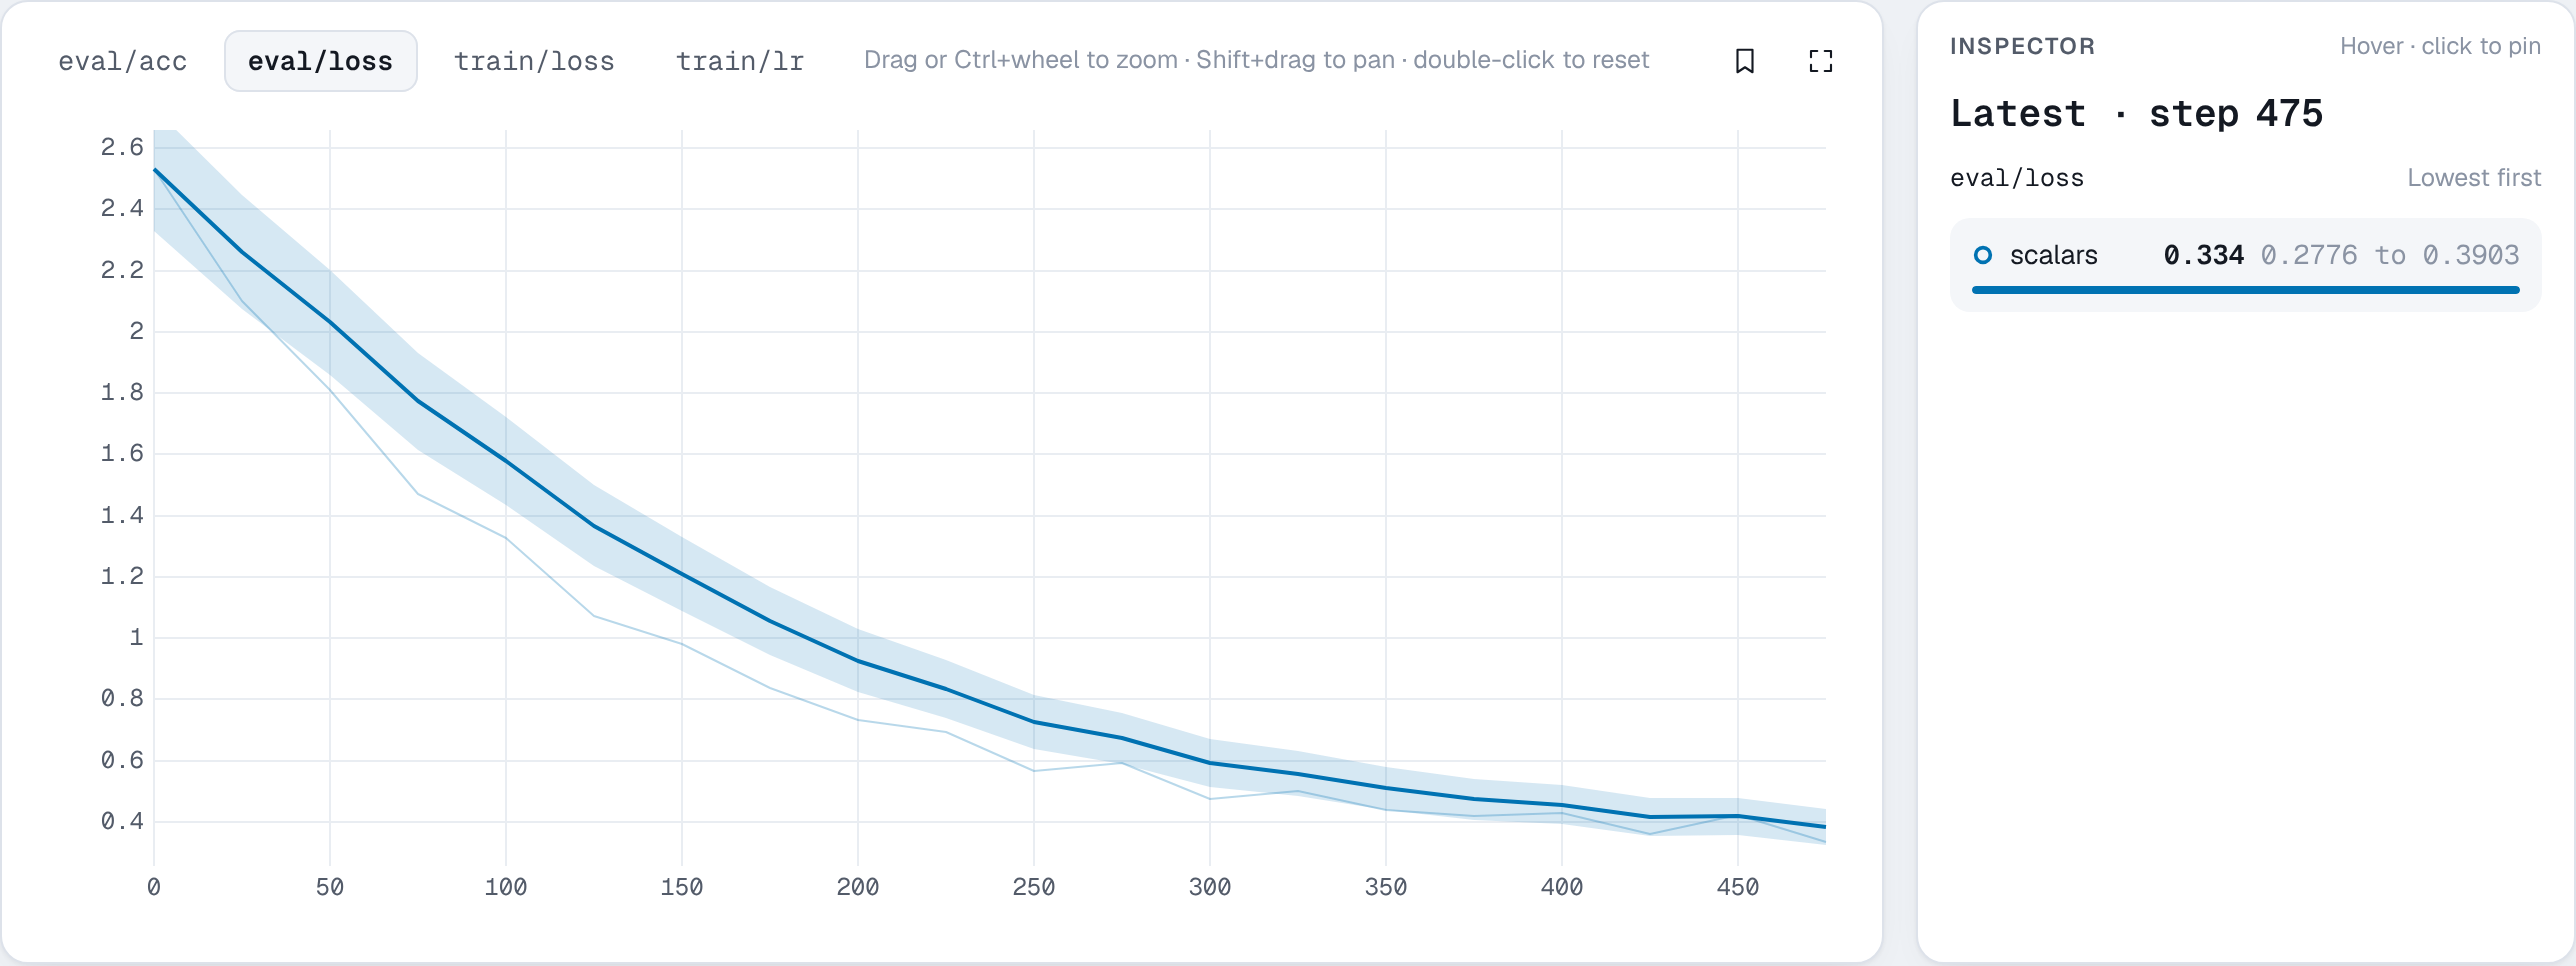
In the viewer each key is a line chart on the Charts page, with one
line per run, grouped in sections by the key's prefix. A scalar logged with
low and high gets a shaded band in its run's color, and the inspector
shows the range next to the value. Runs can be grouped into a mean and spread
band (then the band shows the spread across runs, and the logged ranges are
not drawn), smoothed, and plotted against wall time or another scalar. NaN and infinite values are stored as they are and flagged on
the chart and by the health alerts. The Runs table shows
each run's best or last value of a scalar you pick, and queries can filter on
it (train/loss.min < 0.3).
Example
import math

import nuboard as nb

run = nb.init("api-tour", run_name="scalars")

for step in range(500):
    lr = 1e-3 * min(1, step / 50) * 0.5 * (1 + math.cos(math.pi * step / 500))
    loss = 2.2 * math.exp(-step / 120) + 0.25 + 0.04 * math.sin(step / 7)
    run.add_scalar({"train": {"loss": loss, "lr": lr}}, step=step)

    if step % 25 == 0:
        # mean and std over evaluation batches, logged as a range
        mean, std = loss + 0.08, 0.05 + 0.15 * math.exp(-step / 150)
        run.add_scalar("eval/loss", mean, step=step, low=mean - std, high=mean + std)
        run.add_scalar("eval/acc", 1 - loss / 3, step=step)

run.finish()
Expected result
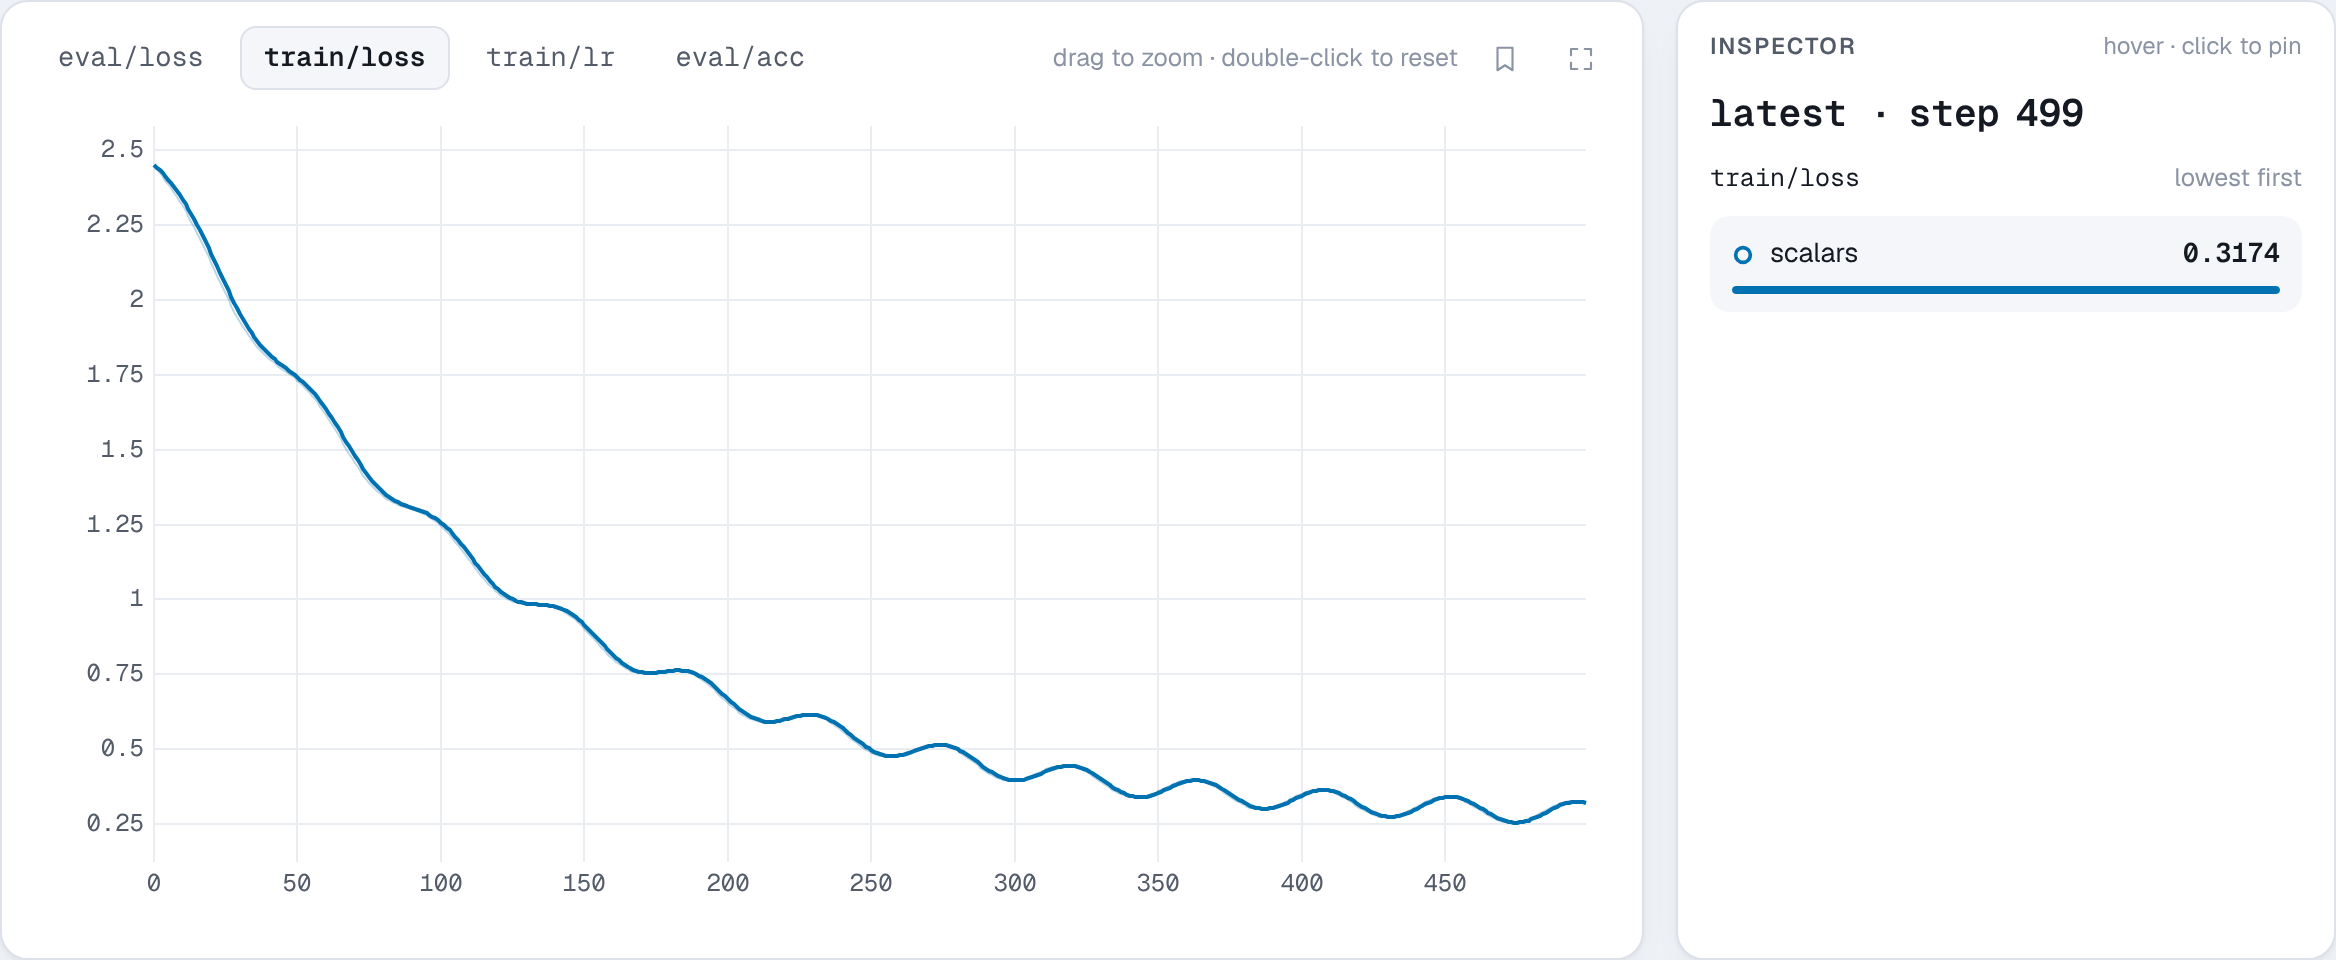
eval/loss, logged with low and high, has a shaded band around its line: