add_scalar_baseline
run.add_scalar_baseline(key, value=None, *, low=None, high=None)
Sets a reference value for a scalar, such as the score of the unprocessed input, so its chart shows how far the model is from doing nothing:
run.add_scalar_baseline("val/pesq", 1.31)                       # value only
run.add_scalar_baseline("val/pesq", 1.31, low=1.19, high=1.43)  # with a range
run.add_scalar_baseline({"val/pesq": 1.31, "val/stoi": 0.82})   # several
The baseline belongs to the scalar logged under the same name with
add_scalar. It can be set before or after that scalar is
logged; setting it again replaces it. A baseline whose scalar is never logged
is not drawn.
Parameters
- key (str or dict): the scalar's name, such as
"val/pesq", or a dict of names and values to set several at once. - value: the reference value, when
keyis a name. Any number typeadd_scalaraccepts works. - low, high (optional): a range around the value, given together, such
as
mean - stdandmean + stdover the validation set. Only with a single name, not a dict.
Raises TypeError when key is a name and value is missing, when only
one of low and high is given, or when they are given with a dict;
ValueError when a value is NaN or infinite.
Stored as the baselines key of run.json, written right away (see the
file format). The event log is not touched. Only
rank 0 writes it.
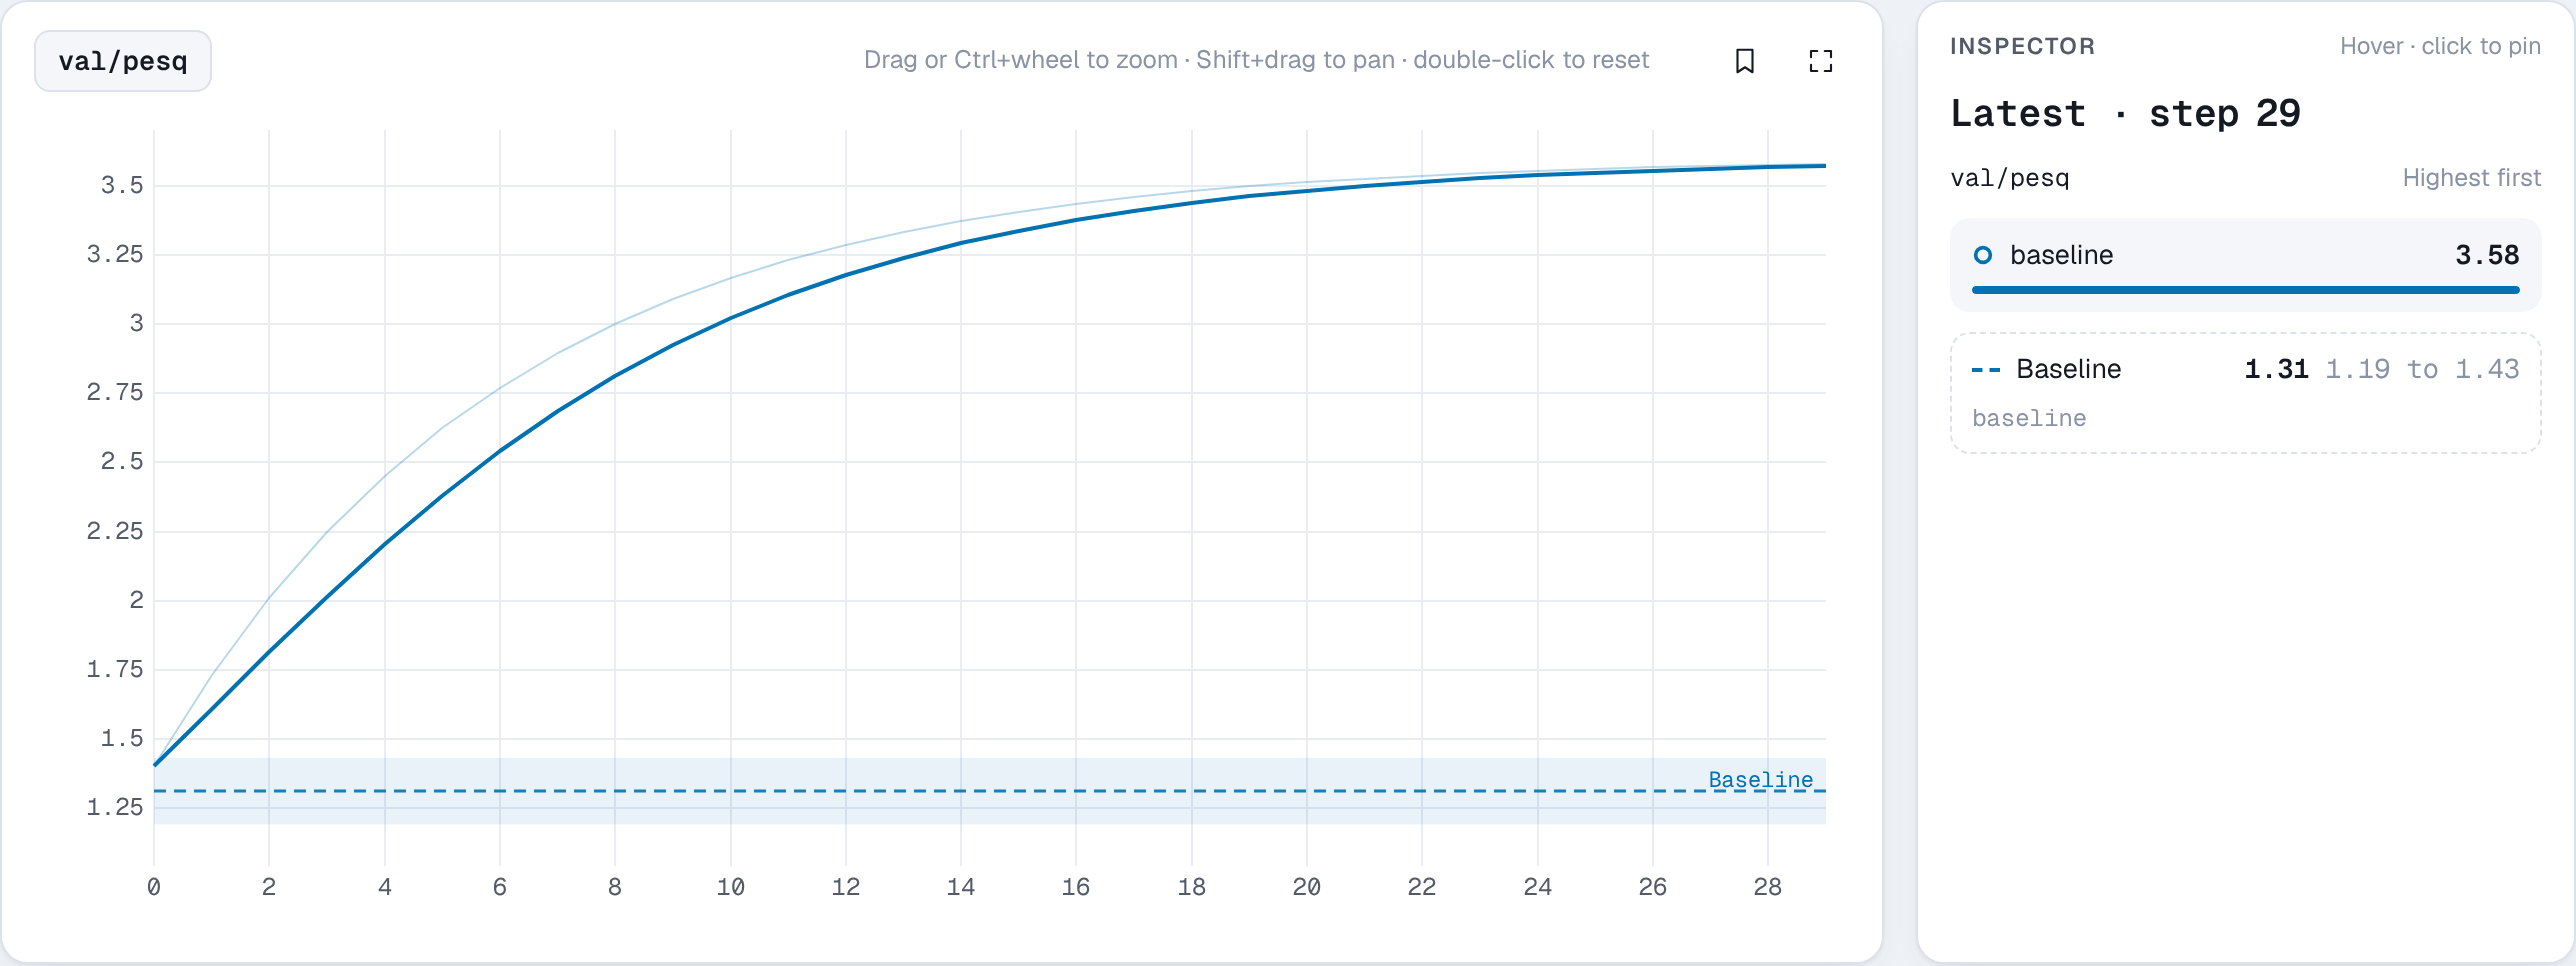
In the viewer the scalar's chart draws the baseline as a dashed horizontal
line, with a light band for low and high. Runs whose baselines match share
one gray line; a baseline only one run has is dashed in that run's color.
Hiding a run in the legend hides its baseline, and highlighting a run
highlights its baseline. Grouped charts draw each group's mean baseline. The
inspector lists every baseline with the runs it belongs to, and the y-axis
stretches to keep baselines in view. The Baseline switch on the Charts
page, shown when a run has a baseline, turns them off.
Example
import nuboard as nb

run = nb.init("api-tour", run_name="baseline")
run.add_scalar_baseline("val/pesq", 1.31, low=1.19, high=1.43)  # the noisy input

for epoch in range(30):
    run.add_scalar("val/pesq", 3.6 - 2.2 * 0.85**epoch, step=epoch)

run.finish()
Expected result