add_table
run.add_table(key, rows, step=None, *, row_id=None, time=None)
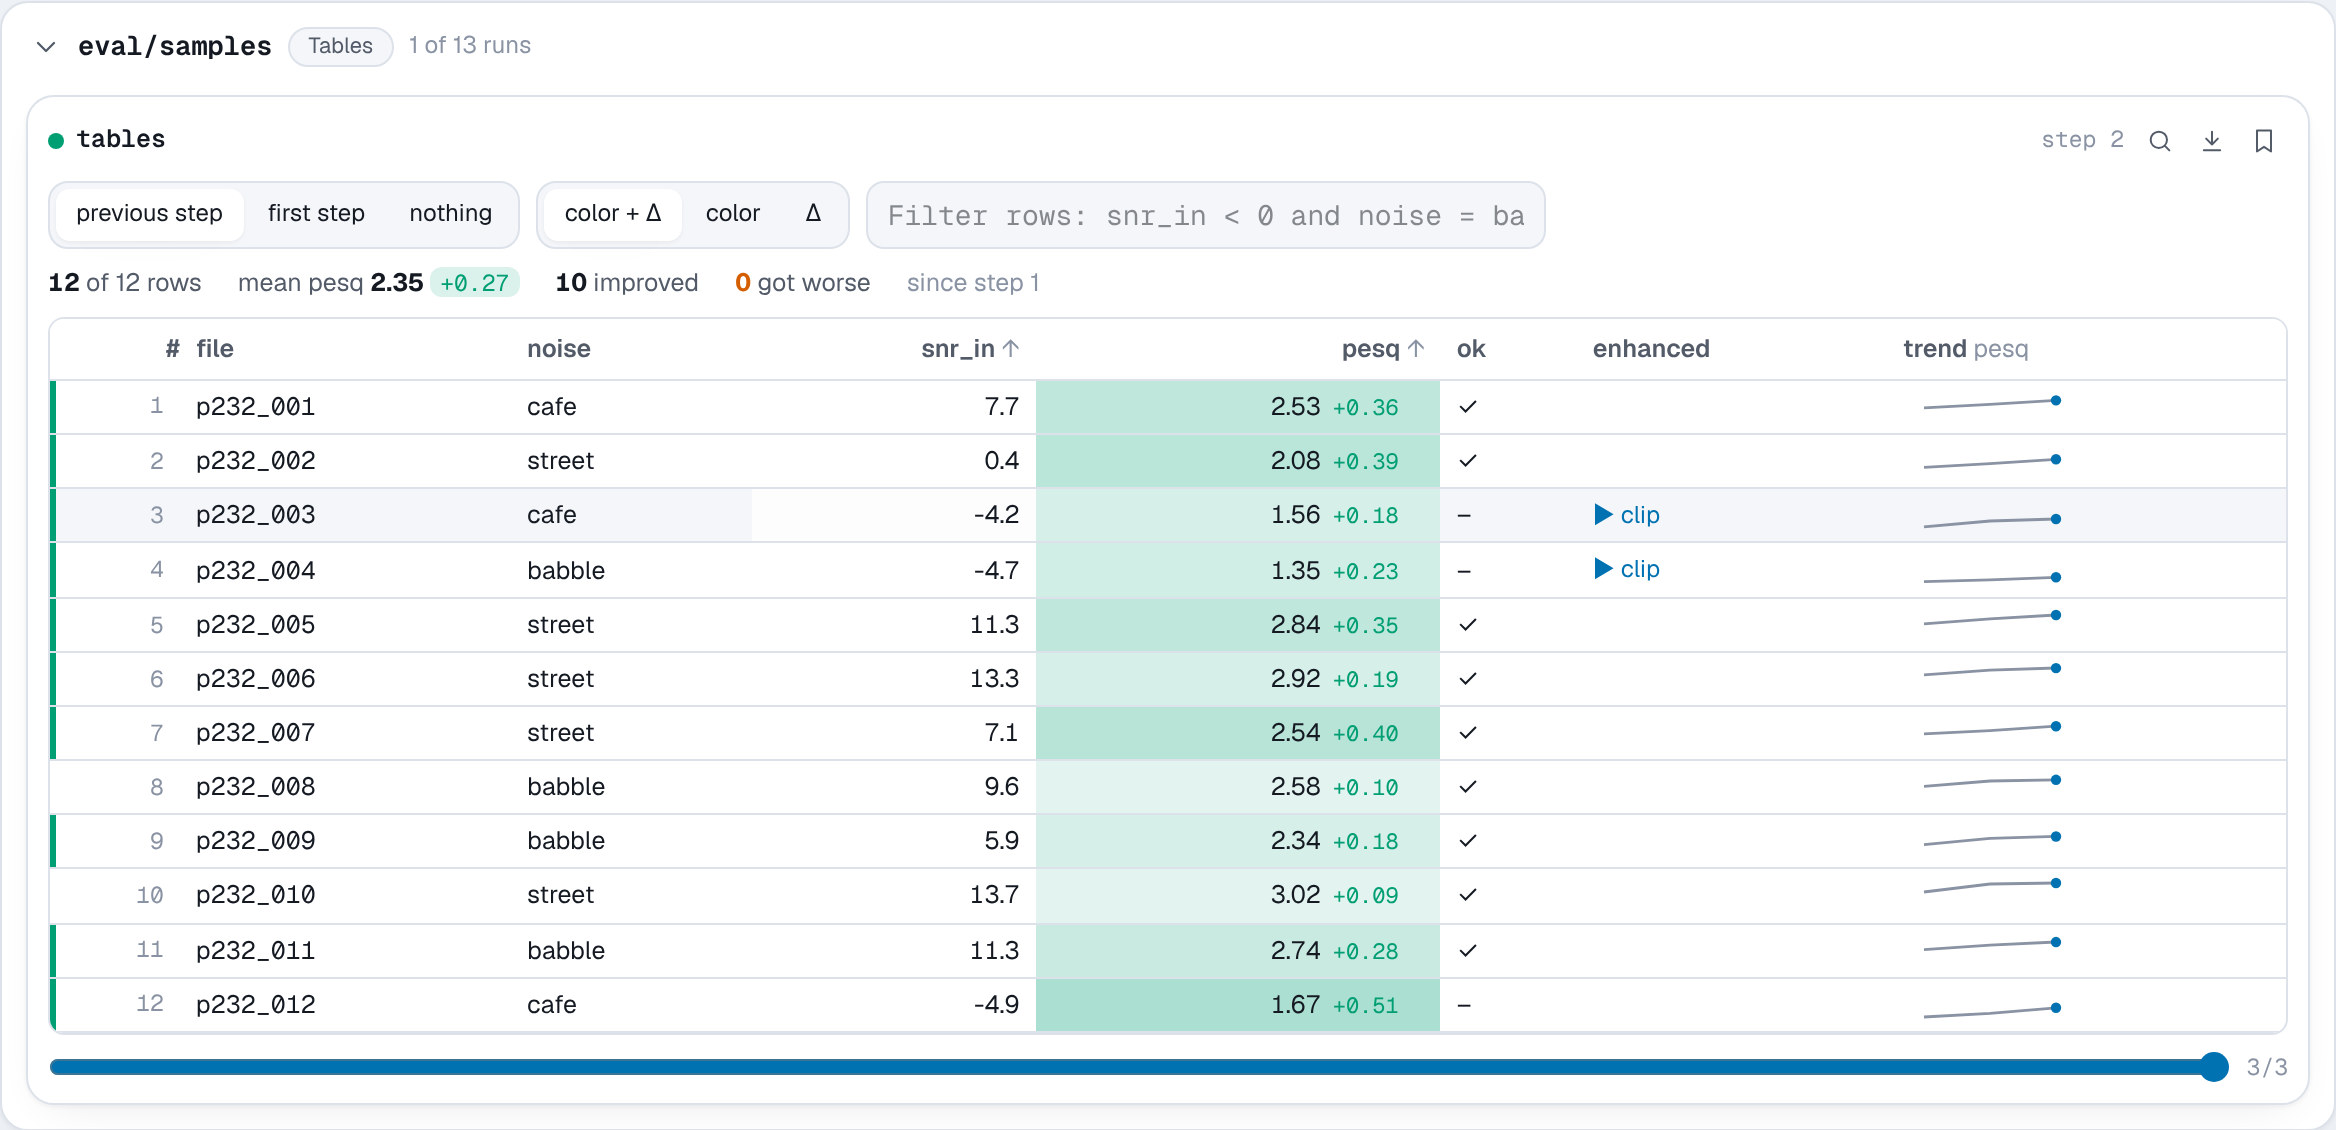
Logs a table, such as one row per test example with its scores. Log the same table at each evaluation and the viewer shows how each row changed.
Parameters
- key (str): the name the table is logged under.
- rows: one of
- a list of dicts, one per row (keys missing from a row are empty cells);
- a dict of column lists;
- a pandas DataFrame.
- step (int, optional): the training step.
- row_id (str, optional): the column that identifies a row across steps, such as a file name. Defaults to the first column.
Cells can be numbers, booleans, strings or None. NumPy and tensor scalars
become numbers, NaN and infinities become empty cells, and anything else
becomes its str. A cell can also hold media:
nb.Audio(data, sample_rate=None, caption=None)takes whatadd_audiotakes.nb.Image(data, caption=None)takes whatadd_imagetakes.
Each column gets a type from its cells: number, bool, text, audio or image.
Stored as JSON, about 50 bytes per row of numbers, written with the standard library. Media cells are stored as their own audio and image items at the same step, so attach media only to the rows worth looking at, such as the worst few.
In the viewer tables take the section's full width and are listed under
Tables. Each number is compared with the same row at the previous step or
the first step, and tinted green when it got better and orange when it got
worse. A column whose name looks like a loss or error (loss, error, wer)
counts as better when lower. You can sort, filter rows with comparisons such
as snr_in < 0 and noise = babble, plot a column's trend per row over steps,
and click a row for its values at every step and its media. See
Tables.
Example
import numpy as np

import nuboard as nb

run = nb.init("api-tour", run_name="tables")
rng = np.random.default_rng(0)
files = [f"p232_{i:03d}" for i in range(1, 13)]
snr_in = rng.uniform(-5, 15, len(files)).round(1)
noise = rng.choice(["babble", "cafe", "street"], len(files))
rate = 16_000
t = np.arange(rate) / rate

for epoch in range(3):
    pesq = (1.2 + 0.08 * snr_in + 0.35 * epoch + rng.normal(0, 0.1, len(files))).round(2)
    rows = [
        {"file": f, "noise": n, "snr_in": s, "pesq": p, "ok": bool(p > 2)}
        for f, n, s, p in zip(files, noise, snr_in, pesq)
    ]
    for r in sorted(rows, key=lambda r: r["pesq"])[:2]:  # the two worst files
        clip = np.sin(2 * np.pi * 330 * t) * 0.3 + rng.normal(0, 0.1 / (1 + epoch), t.size)
        r["enhanced"] = nb.Audio(clip, sample_rate=rate)
    run.add_table("eval/samples", rows, step=epoch)

run.finish()
Expected result